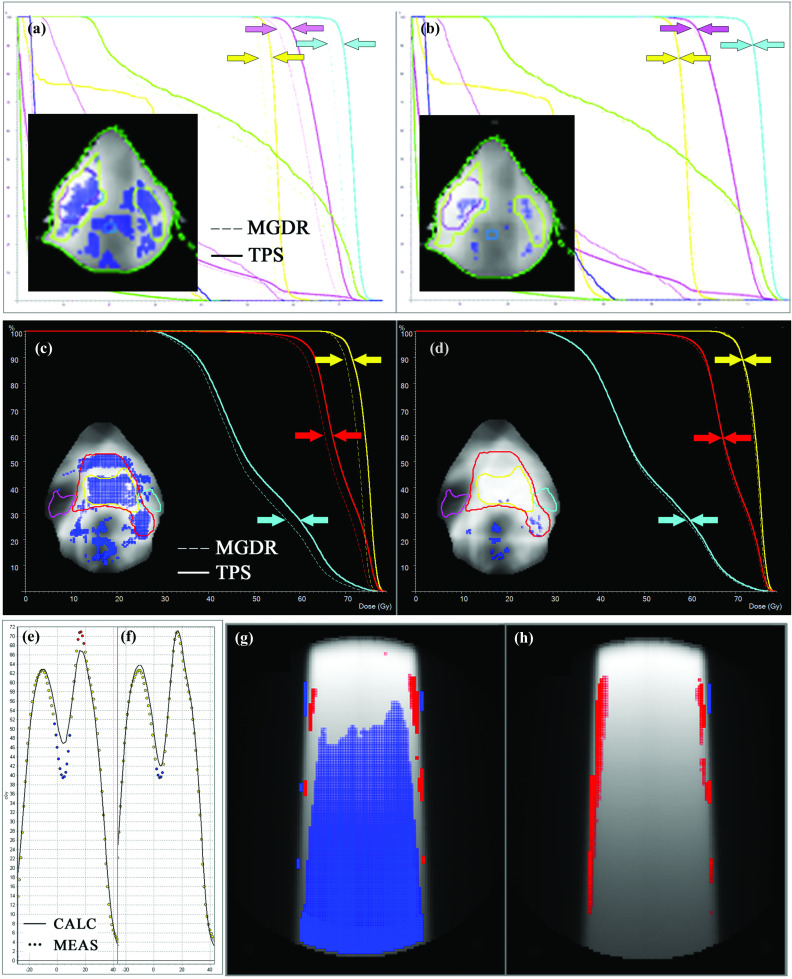
FIG. 8.
[(a) and (b)]: Before (a) and after (b) detection and removal of leaf-end error described by Case Study 1, exhibited for a different head and neck case to illustrate the systematic improvement in dose difference and DVH impact. Arrows have been added to three PTV curves to highlight convergence. [(c) and (d)]: Before (c) and after (d) application of the correct T and G effect by the TPS as described by Case Study 2. Arrows for two PTV curves and the ipsilateral parotid have been added to highlight convergence. [(e) and (f)]: Before (e) and after (f) improving the beam model by rescanning profiles with a small diode detector to eliminate the volume averaging effects of the original scans made with ion chamber. [(g) and (h)]: Phantom dose comparison (TPS vs measured) before (g) and after (h) correction of the QA phantom density configuration in the TPS.

