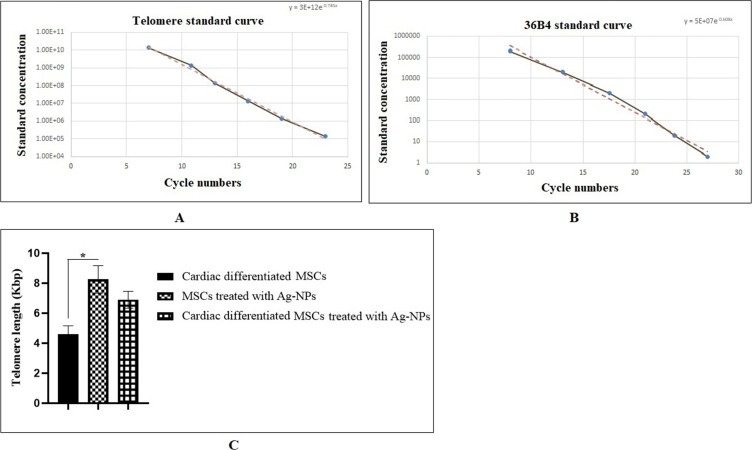
Figure 5.
aTL measurement of cardiomyogenically differentiated BM-MSCs. (A) Standard curve for calculating the aTL sequence per reaction tube; (B) standard curve for calculating genome copies using the 36B4 copy number (The x-axis represents the number of the cycle and the y-axis shows the concentration of the standard). (C) Real-time PCR was carried out with 20 ng/μL of DNA from three groups for evaluating the aTL in triplicate (*p < 0.05; compared with control group, n = 3). The data were analyzed as kb/reaction and the genome copies/reaction for the telomere and the SCG.

