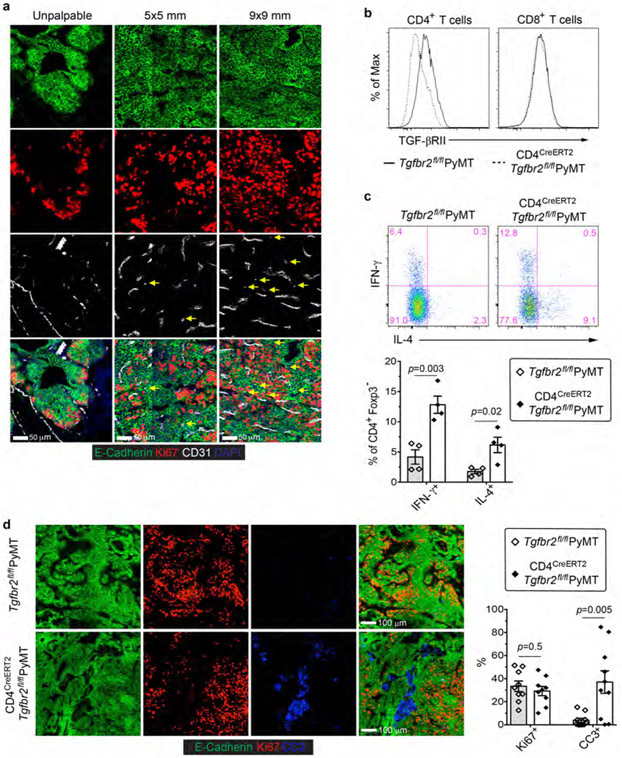
Extended Data Fig. 1 ∣. Inducible ablation of TGF-βRII in CD4+ T cells causes enhanced T helper cell responses and increased cancer cell death.
a, Representative immunofluorescence images of CD31 (white), Ki67 (red) and E-Cadherin (green) in mammary tumor tissues from PyMT mice harboring unpalpable, 5x5 mm, or 9x9 mm tumors. Isolated CD31+ staining in the tumor parenchyma (yellow arrows) is indicated. b, TGF-βRII expression on CD4+ T cells and CD8+ T cells from the tumor-draining lymph nodes of Tgfbr2fl/flPyMT and CD4CreERT2Tgfbr2fl/flPyMT mice treated with tamoxifen. c, Representative flow cytometry plots and statistical analyses of IL-4 and IFN-γ expression in CD4+Foxp3− T cells from the tumor-draining lymph nodes of Tgfbr2fl/flPyMT and CD4CreERT2Tgfbr2fl/flPyMT mice treated with tamoxifen. d, Representative immunofluorescence images of E-Cadherin (green), Ki67 (red) and cleaved Caspase 3 (CC3, blue) in mammary tumor tissues from Tgfbr2fl/flPyMT and CD4CreERT2Tgfbr2fl/flPyMT mice treated with tamoxifen. The percentage of Ki67+E-Cadherin+ cells over total E-Cadherin+ epithelial cells was calculated from 0.02 mm2 regions (n=9). The percentage of CC3+ areas over total E-Cadherin+ areas was calculated from 0.02 mm2 regions (n=10). All statistical data are shown as mean ± SEM. Two-tailed unpaired t-test (c, d). Data are pooled biological replicates (c) or representative of three independent experiments (a, b, d).

