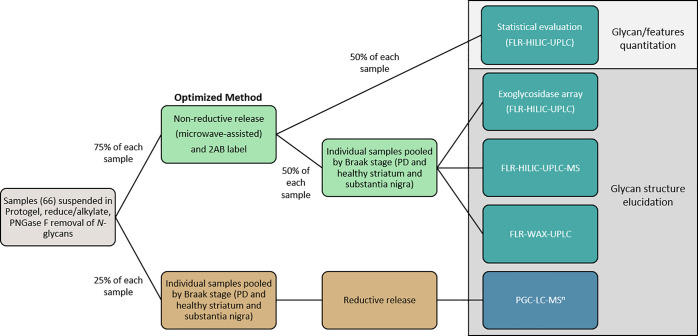
Figure 1.
Workflow schematic of sample preparation and analysis incorporating both reductive (lower brown track) and nonreductive (upper green track) β-elimination techniques and analytical approaches. In total, 66 samples were set in the gel and had N-glycans cleaved and separated. 25% of each sample gel was pooled into four respective groups—healthy striatum, PD striatum (containing Braak stages 1–4), healthy substantia nigra, and PD substantia nigra (containing Braak stages 1–4). The combination of ILBD (stages 1–2) and PD (stages 3–4) was required due to low sample numbers from ILBD (three patients—three striata and three substantia nigra samples). Healthy groups acted as the control for each brain region. These pools were subjected to reductive β-elimination, and recovered glycan alditols were identified using MS1, MS2, and MS3 analyses to confirm composition and linkage position. With knowledge of reduced glycan profiles for each pool, the remaining 75% of each sample gel was subjected to microwave-assisted nonreductive β-elimination and 2AB labeling. 50% of each sample glycan release was analyzed by FLR-HILIC-UPLC for statistical evaluation. The remaining 50% of released glycans were pooled into their respective groups and subjected to exoglycosidase digestions (followed by another round of FLR-HILIC-UPLC analysis) and orthogonal FLR-HILIC-UPLC-MS1 analysis to corroborate exoglycosidase findings, referenced against glycan alditols analyzed by PGC-LC-MSn. FLR-WAX-UPLC analysis was also performed to confirm glycan charge distribution across the profile for each group.

