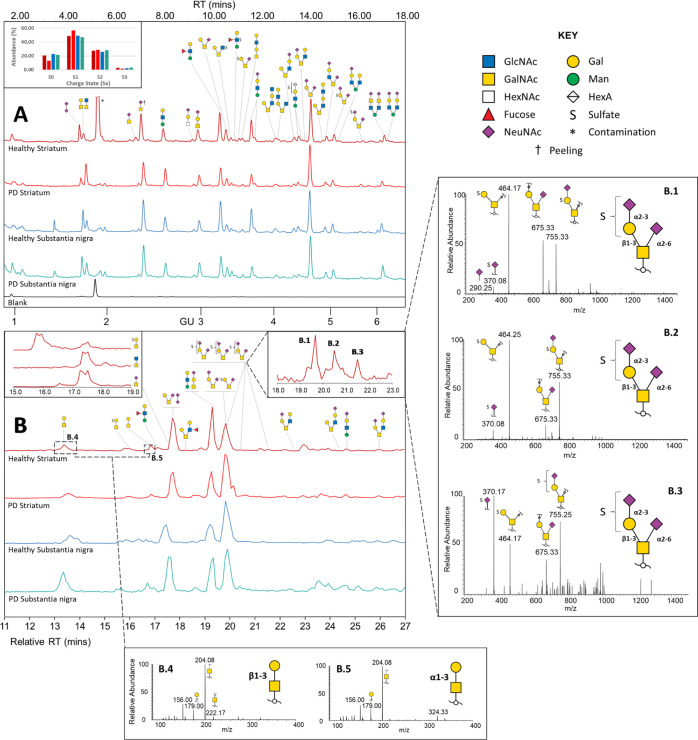
Figure 2.
(A) Representative FLR-HILIC-UPLC chromatograms (top) of O-glycans in brain sample pools. Integrated peaks on chromatograms are shown in Figure S4. The inset FLR-WAX-UPLC graph shows relative abundance of 2AB-labeled glycans by the charge state (Sx) (bar colors correspond to chromatogram colors). FLR-WAX-UPLC chromatograms shown in Figure S5. (B) PGC-LC-MSn base peak chromatograms (bottom) of O-glycans in brain sample pools (relative RT to the healthy striatum). Insets show example EICs outlining coelution of structures (left; m/z 464, 425, and 513) and separation of glycan isomers (right; m/z 1046—B.1–B.3). Further MS2 spectra of these three isomers are shown on the right panel, indicating structures which place the sulfate modification on the galactose or the sialic acid residue, outlining the circumstance of potential sulfate migration during MS detection. Core 1 and proposed core 8 O-glycan alditol isomers (m/z 384) analyzed with PGC-LC-MS2 are shown in (B.4,B5). The elution time of Galβ1-3GalNAc at 13.4 min was confirmed using reference standards analyzed at the same occasion. Only major structures are shown.

