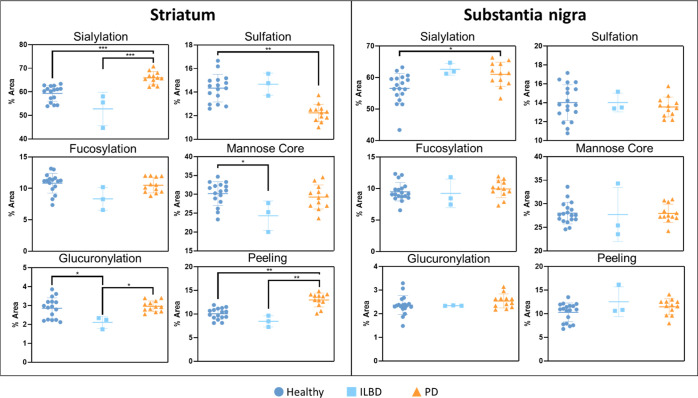
Figure 3.
Nested plots of significant changes in striatum and substantia nigra based on grouping of identified glycans by feature (sialylation, fucosylation, sulfation, glucuronylation, glycans with mannose cores, and peeling). % areas for these features in the individual samples in each group were compared against disease states in the striatum and substantia nigra. The significance across groups is written as follows: * (p < 0.05), ** (p < 0.01), and *** (p < 0.001).

