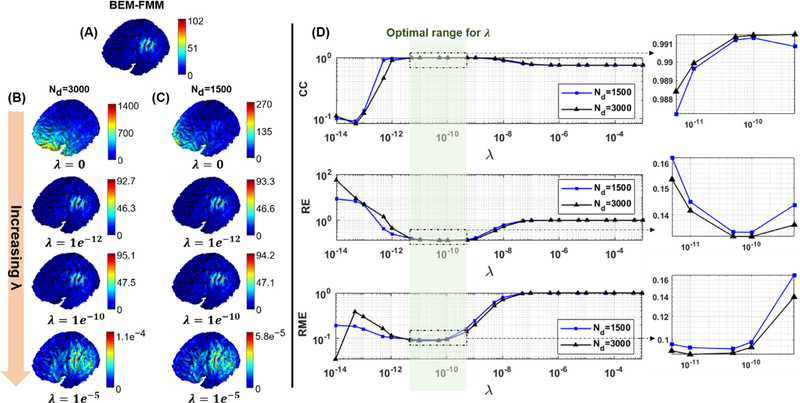
Fig. B1.
(A) The reference total E-field calculated by the BEM-FMM method. (B) The DB-MSP approximations for increasing values of λ for the 3000 dipole basis set. (C) Corresponding results for 1500 dipole basis set. (D) Effects of the regularization parameter on the accuracy metrics. When the value of λ is between 5e−12 and 5e−10 all the metrics remain within a reasonable range. Increasing λ to be more than 1e−9 still provides an acceptable spatial distribution for the real-time visualization of the E-field in terms of CC, however the intensity of the approximated E-field is reduced due to the bias caused by over-regularization. Similarly, choosing a smaller value of λ tends to cause a numerical instability in the approximation and a high degree of inconsistency both in the spatial distribution and intensity of the E-field.

