FIGURE 6.
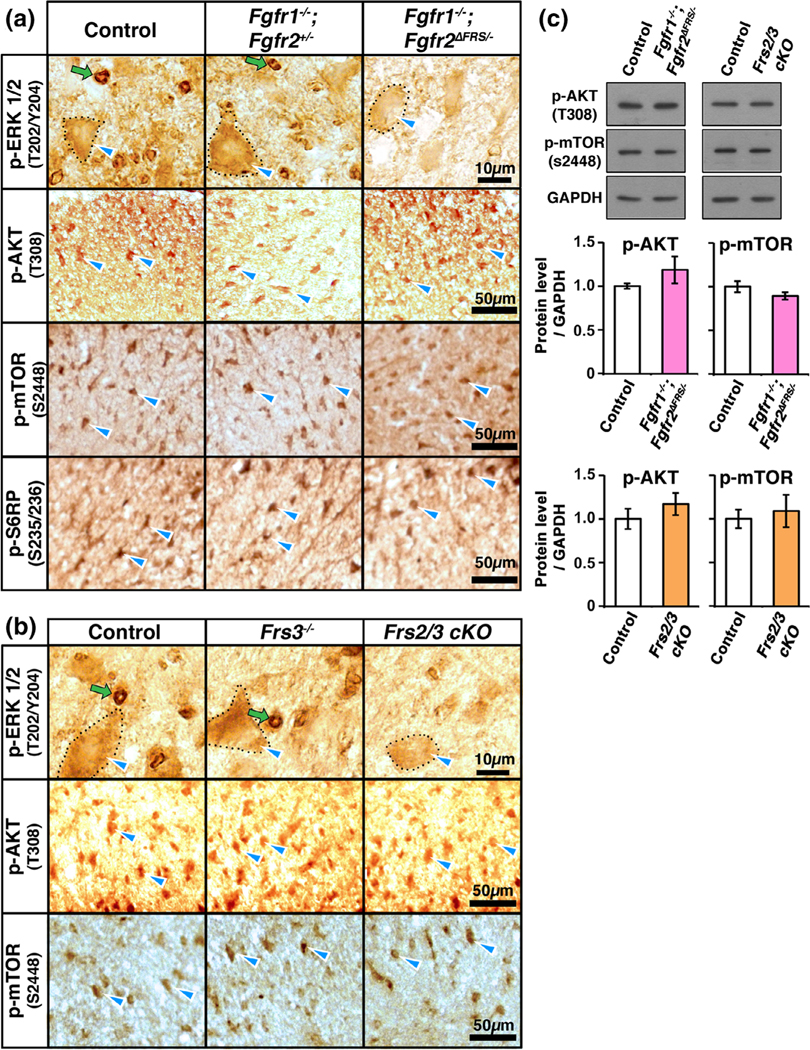
p-ERK1/2 expression is partly reduced but p-Akt, p-mTOR and p-S6RP remain unchanged in oligodendrocytes of mice with disruption of Frs2/3 binding to Fgfr2 or with complete ablation of Frs2/3 in oligodendrocytes. Cervical spinal cord sections at P15, immunolabeled for p-ERK1/2, show oligodendrocyte-like cellular staining (outlined in dotted line, blue arrowhead) and “ring-like” paranodal staining (green arrows) in the white matter of control, Fgfr1−/−;Fgfr2+/− (a), and Frs3−/− (b) mice. Compared to this pattern in the controls, the oligodendrocyte-like cellular staining of p-ERK1/2 is slightly decreased, but the “ring-like” staining is significantly reduced in the Fgfr1−/−; Fgfr2ΔFrs/− (a) and Frs2/3 cKO (b) mice (numbers of “rings” counted in the white matter of control = 440.09+/− 32.9, and Frs2/3 cKO = 78.82 +/− 9.2mm2). The intensity of the cellular signal for pAkt308, p-mTORS2448, and p-S6RPS235/236 remains comparable to controls for all genotypes. (c) Immunoblotting of equal amounts of total proteins from homogenates of cervical spinal cord and quantification of the band intensities show that p-AKT and p-mTOR expression levels are not significantly reduced at P15 in the Fgfr1−/−;Fgfr2ΔFrs/− or Frs2/3 cKO mice compared to their respective controls. GAPDH is used as a loading control. Error bars represent SEM. N = 3–7 for each genotype. Scale bars as indicated. Representative images taken from similar regions of lateral-ventral white matter are shown [Color figure can be viewed at wileyonlinelibrary.com]]

