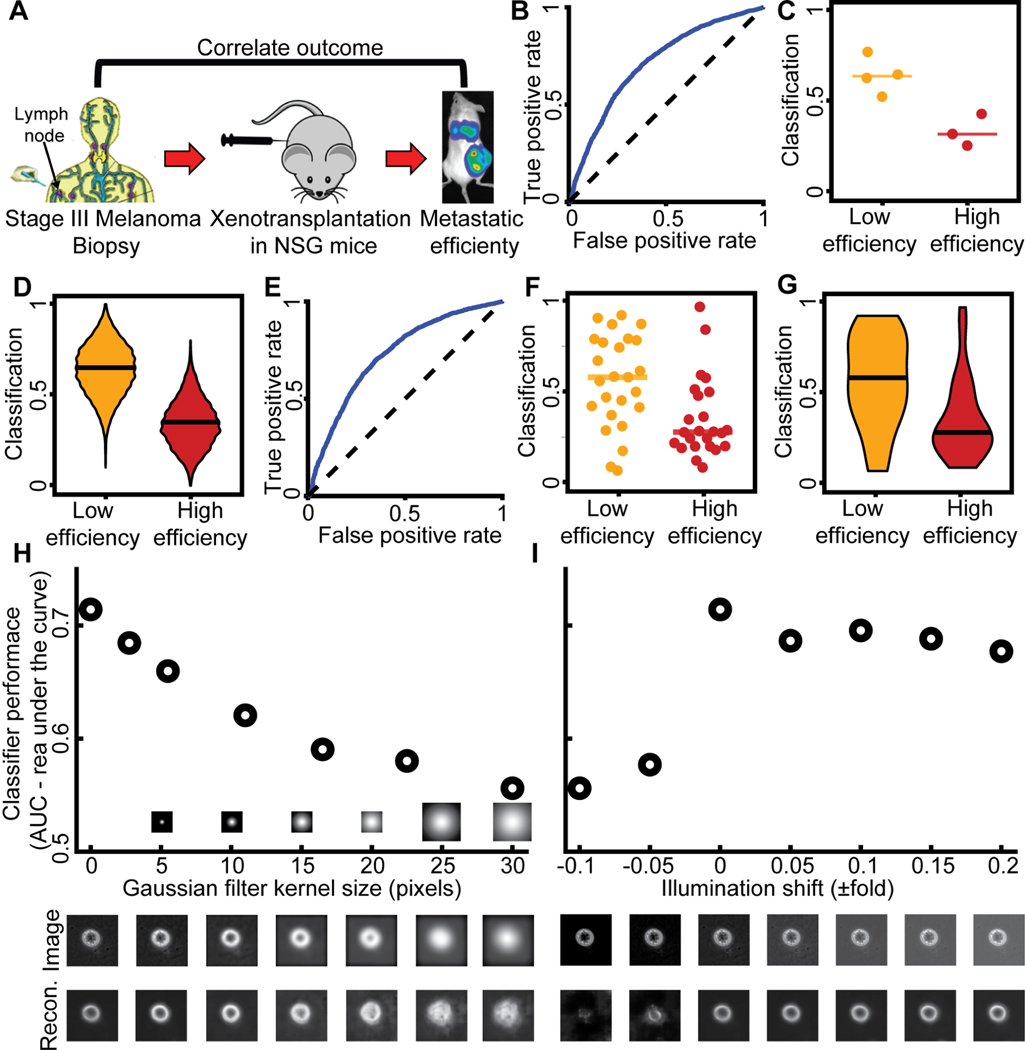
Figure 3. Discrimination of PDXs with low versus high metastatic efficiency as defined by the correlation between outcomes in mouse and man.
(A) (Quintana et al., 2012). Classifiers were trained to predict metastatic efficiency at the single cell level (panels B, E). The association of a particular PDX with either the category ‘Low’ [metastatic efficiency] or the category ‘High’ [metastatic efficiency] was determined at the population level – either considering the fraction of all cells of a PDX predicted as ‘Low’ (C, F) or a bootstrap sample of 20 cells (D, G). (B) Receiver Operating Characteristic (ROC) curve for single cell classification. AUC = 0.71. (C) Accuracy in predicting for a single PDX (cell type) its association with the category ‘Low’ versus the category ‘High’. Each data point indicates the outcome of testing a particular cell type by the fraction of individual cells classified as ‘Low’. N = 7 PDXs: 4 low efficiency, 3 high efficiency metastasizers. 7/7 predictions are correct. Wilcoxon rank-sum and Binomial statistical test on the null hypothesis that the classifier scores of PDX with low versus high metastatic efficiency are drawn from the same distribution, p = 0.0571 (Wilcoxon), p ≤ 0.00782 (Binomial), see Methods for justification of the statistical tests. (D) Bootstrap distribution of the prediction of a PDX as a member of the ‘Low’ category. For each PDX we generated 1000 observations by repeatedly selecting 20 random cells and recorded the fraction of these cells that were classified as ‘Low’. Horizontal line - median. Wilcoxon rank-sum test p < 0.0001 rejecting the null hypothesis that the classifiers scores of observations from the two categories stem from the same distribution. This analysis demonstrated the ability to predict metastatic efficiency from samples of 20 random cells. (E-G) Discrimination results using classifiers that were blind to the cell type and day of imaging (Fig. S4A, more observations, smaller n - number of cells for each observation). (E) Receiver Operating Characteristic (ROC) curve; AUC = 0.723. (F) Accuracy in predicting for one PDX on a particular day (cell type) its association with the category ‘Low’ versus the category ‘High’. Each data point indicates the outcome of testing one PDX on a particular day by the fraction of individual cells classified as ‘Low’. N = 49 cell types and days: 25 low metastatic efficiency, 24 high metastatic efficiency. 32/49 predictions were correct. Wilcoxon rank-sum and Binomial statistical test on the null hypothesis that the classifier scores of PDX with low versus high metastatic efficiency are drawn from the same distribution p = 0.0042 (Wilcoxon), p ≤ 0.0222 (Binomial). (G) Bootstrap distribution of the prediction of a PDX imaged in one day as member of the ‘Low’ category. See panel D. Horizontal line - median. Wilcoxon rank-sum test p < 0.0001 rejecting the null hypothesis that the classifiers scores of observations from the two categories stem from the same distribution. (H) Robustness of classifier against image blur. Blur was simulated by filtering the raw images with Gaussian kernels of increased size. The PDX m528 was used to compute AUC changes as a function of blur. Representative blurred image (middle) and its reconstruction (bottom). (I) Robustness of classifier to illumination changes. AUC as a function of altered illumination (top). Representative image of m528 cell after simulated illumination alteration (middle), and its reconstruction (bottom).

