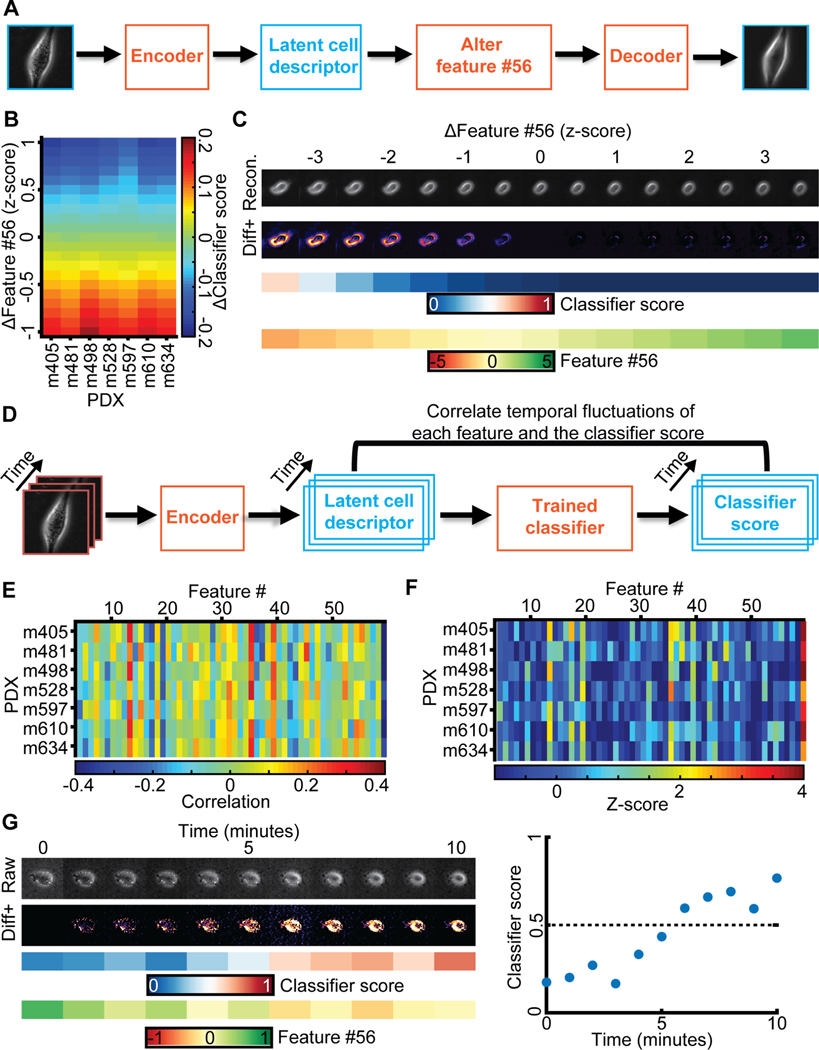
Figure 5. Generative modeling of cell images to interpret the meaning of feature #56.
(A) Approach: alter feature #56 while fixing all other features in the latent space cell descriptor to identify interpretable cell image properties encoded by feature #56. (B) Shifts in feature #56 (y-axis, measured in z-score) negatively correlated with variation in the classifier scores. (C) In silico cells generated by decoding the latent cell descriptor of a representative m498 PDX cell under gradual shifts in feature #56 (“Recon.”). Visualization of the intensity differences between consecutive virtual cells (Izscore - Izscore+0.5), only positive difference values are shown (“Diff+”). Changes in feature #56 are indicated in units of the z-score. The corresponding classifier’s score and value of feature #56 are shown. (D) Approach: correlating temporal fluctuations of each feature to fluctuations in the classifiers’ score. (E) Summary of correlations. Y-axis - different classifiers for each PDX. X-axis - features. Bin (x,y) records the Pearson correlation coefficients between temporal fluctuations in feature #x and the score of classifier #y over all cells of the PDX. (F) Normalization of correlation coefficients as a Z-score. Mean value and standard deviation are derived from the correlation values in panel E. (G) Following a m610 PDX cell spontaneously switching from the low to the high metastatic efficiency domain (as predicted by the classifier). Live imaging for 10 minutes. Left (top-to-bottom): raw cell image, diff+ images, classifier’s score, feature #56 values. Right: visualization of the classifier score as a function of time, switching from “low” to “high” in less than 10 minutes.

