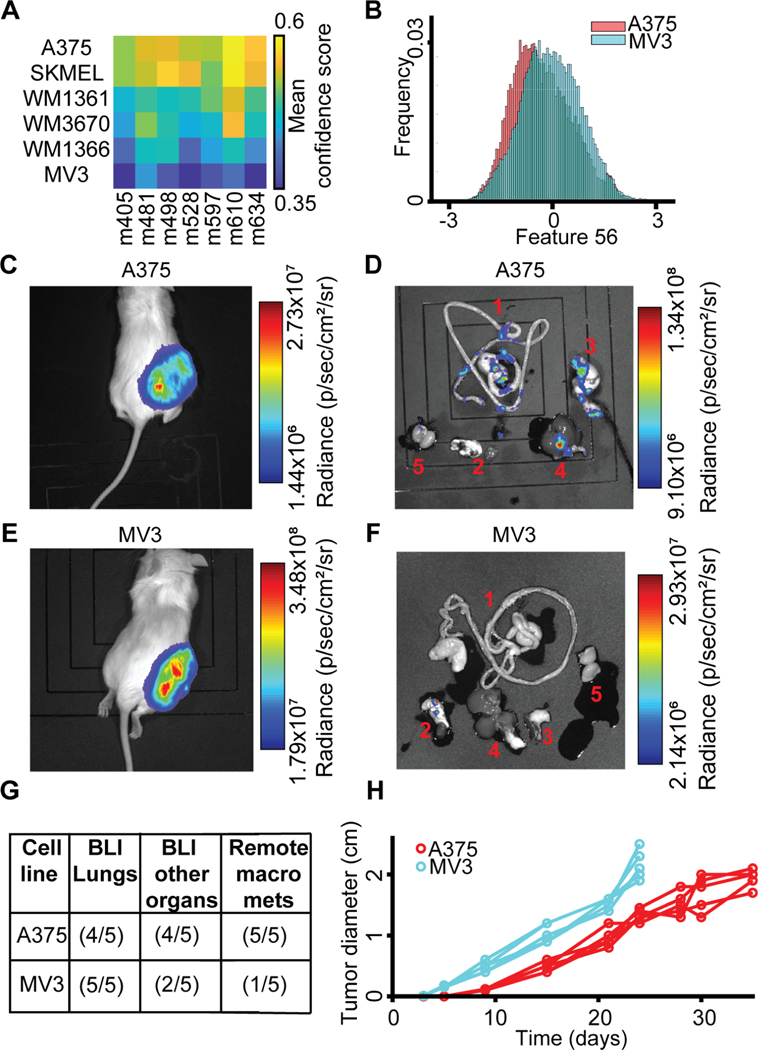
Figure 6. PDX-trained classifiers predict the potential for spontaneous metastasis of mouse xenografts from melanoma cell lines.
(A) All 7 PDX-trained classifiers consistently predicted that among the 6 analyzed cell lines A375 has the highest and MV3 the lowest metastatic efficiency. (B) The distribution of single cell values of feature #56 is lower for A375 than the distribution of values for MV3 cells. (C, E) Bioluminescence (BLI) of NSG mouse sacrificed 24–35 days after subcutaneous transplantation of 100 Luciferase-GFP+ cells from the A375 melanoma cell line (C) versus from the MV3 cell line (E). (D, F) Bioluminescence of organs dissected from the A375 xenografted mouse (D) and from the MV3-xenografted mouse (F). 1, Gastrointestinal Tract (GI); 2, Lungs and Heart; 3, Pancreas and Spleen; 4, Liver; 5, Kidneys and Adrenal glands. In the MV3, mouse metastases were mostly found in the lungs. Black shades are mats on which the organs and mice are imaged (Methods). (G) Summary of metastatic efficiency for A375 and MV3 melanoma cell lines in 5 mice. “BLI Lungs”: Detection of BLI in the lungs. “BLI other organs”: BLI in multiple organs beyond the lungs. “Remote macro mets”: Macrometastases in remote organs (excluding lungs), identification of “visceral metastasis”, macrometastases visually identifiable without BLI, the measure used to define metastatic efficiency to the PDXs in (Quintana et al., 2012). (H) Primary tumors in MV3 xenografts grow faster than in A375 xenografts. Mice were sacrificed 24 days after injection with MV3, 35 days after injection with A375 cells. N = 5 mice for A375 and MV3 cell line. Statistics for tumor size after 24 days p-value = 0.0079 (Wilcoxon rank-sum test), fold = 1.6241.

