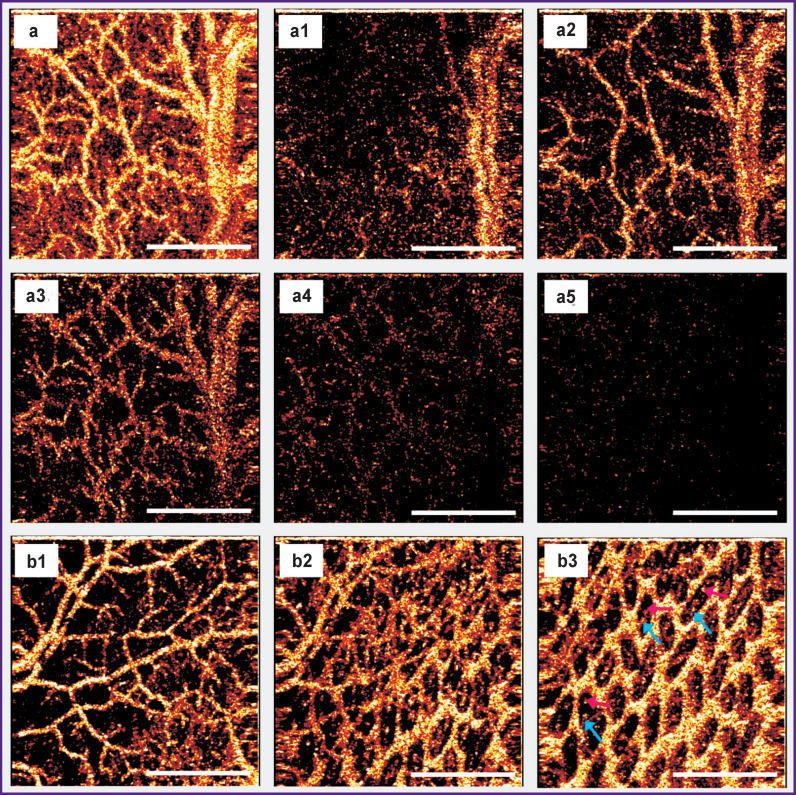
Figure 5. The intramural vascular network of the normal rat small intestine visualized by the OCA method:
(a) a network of blood vessels built over the entire volume of OCT data (z=1800 μm), (a1)–(a5) sequential OCA images constructed over part of the OCT volume (z=150 μm) from the sub-serous layer to the mucous membrane at a depth of 10–160 μm (a1), 80–230 μm (a2), 150–300 μm (a3), 220–370 μm (a4), 290–440 μm (a5). The bulk of blood vessels is visualized in the depth range of 80–300 μm from the surface (images (a2), (a3)), which corresponds to the lower part of the muscle layer, submucosal and mucous layers, including the base of the villi; (b1)–(b3) sequential OCA images constructed over part of the OCT volume (z=150 μm) at the time-point when the fat emulsion was inside the intestinal lumen: at the level of the serous, muscle and part of the submucosal layers (b1); at the level of the submucosal and mucous layers (b2), where bases of the villi are contrasted against the bright background in the lower right corner; at the level of the villi of the mucous membrane (b3), where one can see arterioles and venules located inside the villi (bright points are indicated by blue and pink arrows). Bar — 1 mm

