Fig. 3.
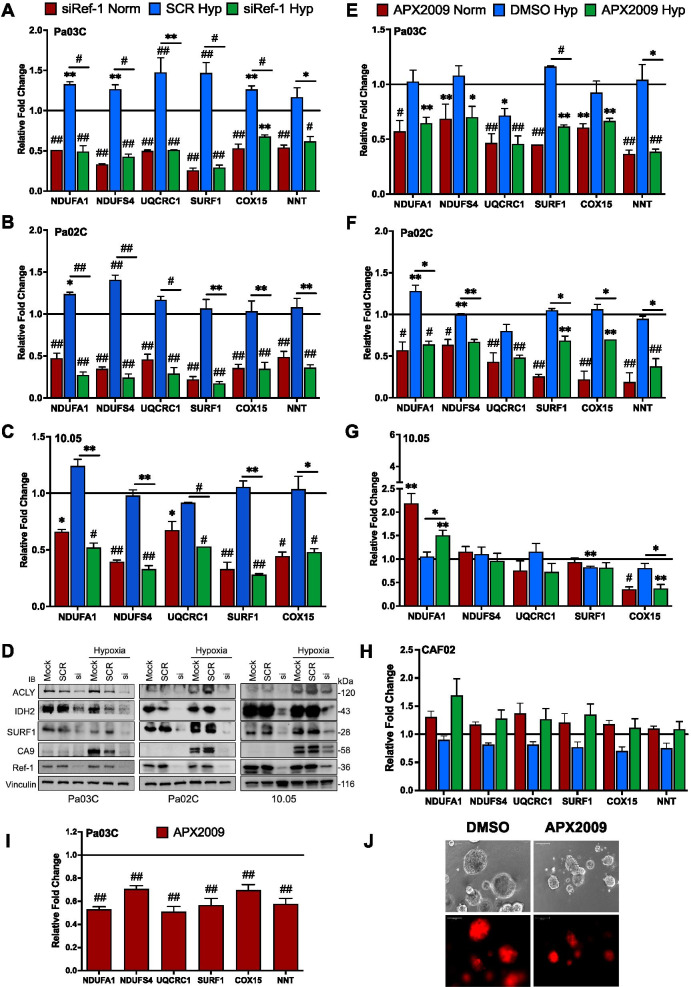
Ref-1 inhibition downregulates mitochondrial complex genes as well as Ref-1 PD marker genes. A-C Validation of selected mitochondrial complex genes from the scRNA-seq data using qRT-PCR in Pa03C (n = 3), Pa02C (n = 3), and Panc10.05 (n = 2) cells (Scr/siRef-1 – 30 nM, 1% hypoxia for 24 h, p < 0.05–0.0001). D Western Blots representing downregulation of mitochondrial metabolic proteins with Ref-1 knockdown 72 h post transfection. E–G Expression of mitochondrial complex genes after treatment with Ref-1 redox inhibitor (APX2009-10 µM for Pa03C, 15 µM for Pa02C and 20 µM for Panc10.05 cells for 28 h) under normoxia and hypoxia (1%O2 for 24 h) (n = 2, p < 0.05–0.0001). H Mitochondrial complex gene expression following Ref-1 redox inhibition (APX2009-10 µM 28 h) under normoxia and hypoxia (1%O2 for 24 h) in CAFs (n = 3). I Mitochondrial complex gene panel after treatment with Ref-1 redox inhibitor (APX2009, 5 µM) compared to vehicle control (DMSO) in Pa03C 3D spheroids (n = 3, p < 0.05–0.0001) and J Images representing the spheroids of Pa03C cells. (Scale Bar – 100 µm, 10X mag). Relative fold change refers to the gene expression changes when compared to Scr or vehicle-treated cells under normoxia

