Fig. 6.
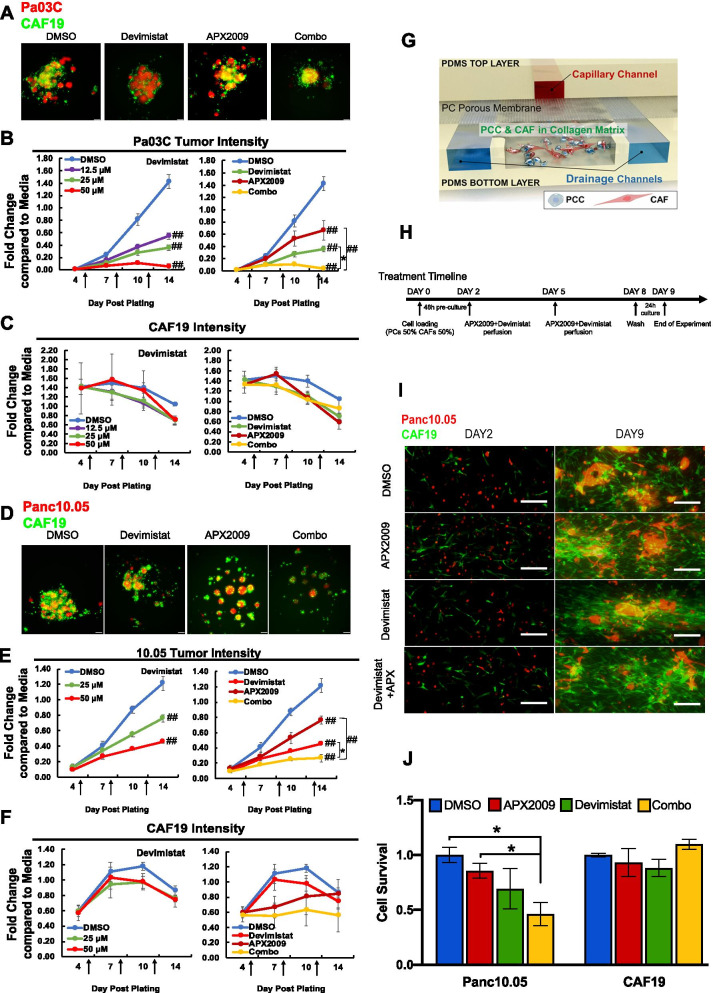
Ref-1 inhibition in combination with Devimistat attenuates growth in two co-culture models of pancreatic cancer: 3D spheroids and i-TMOC. Representative pictures of two low passage patient-derived low passage cell lines, Pa03C (A) and Panc10.05 (D) plated as 3D co-cultures with CAF19 cells at a ratio of 1:4. These co-cultures were treated with increasing concentrations of Devimistat (0–50 µM) and in combination with APX2009 following intensity measurements on Days 4, 7, 10, and 14. For combination treatment in Pa03C cells, Devimistat was held constant at 25 µM and APX2009 at 5 µM, and in Panc10.05, Devimistat was held constant at 50 µM and APX2009 at 10 µM (*p < 0.05, ##0.0001). Intensity of the tumor cells (red (B,E)) as well as the CAFs (green (C,F)) are represented as fluorescence intensity data normalized to Day 14 media control. Graphs are means with standard error of n = 3–4 and arrows correspond to treatment times. G Schematic of functional structure of PDAC iT-MOC and experimental timeline in (H). I Fluorescent microscopic observation of Panc10.05 (red) and CAF19 (green) in PDAC iT-MOC on Day 2 and Day 9. J Quantitation of cell survival in the iT-MOC system with single agent (APX2009 – 30 µM / Devimistat – 25 µM) and combination treatment (n ≥ 3, Mean ± S.E. *p < 0.05)

