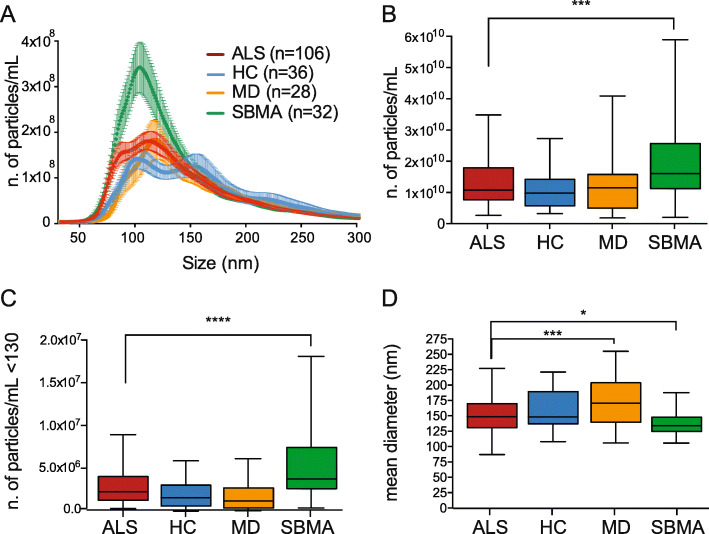
Fig. 2.
ALS plasma EVs are differentially distributed in size and amount compared to HC, MD and SBMA plasma EVs. a Representative average curve of size distribution of ALS, HC, MD and SBMA. b Box-plots showing the number of particles per mL (n. particles/mL) of plasma EV in the four groups; ALS, HC, MD, SBMA; one-way ANOVA, p = 0.0006; ***p = 0.0004 for ALS versus SBMA by Dunnett’s multiple comparisons test. c Box-plots showing the number of particles per mL below 130 nm; one-way ANOVA, p < 0.0001; ****p < 0.0001 for ALS versus SBMA by Dunnett’s multiple comparisons test. d Box-plots showing the mean diameter (nm) of EVs in the four groups; one-way ANOVA, p < 0.0001; ***p = 0.0005 for ALS versus MD and *p = 0.037 for ALS versus SBMA by Dunnett’s multiple comparisons test. b-d Only significant pairwise comparisons, ALS versus HC/MD/SBMA, were indicated

