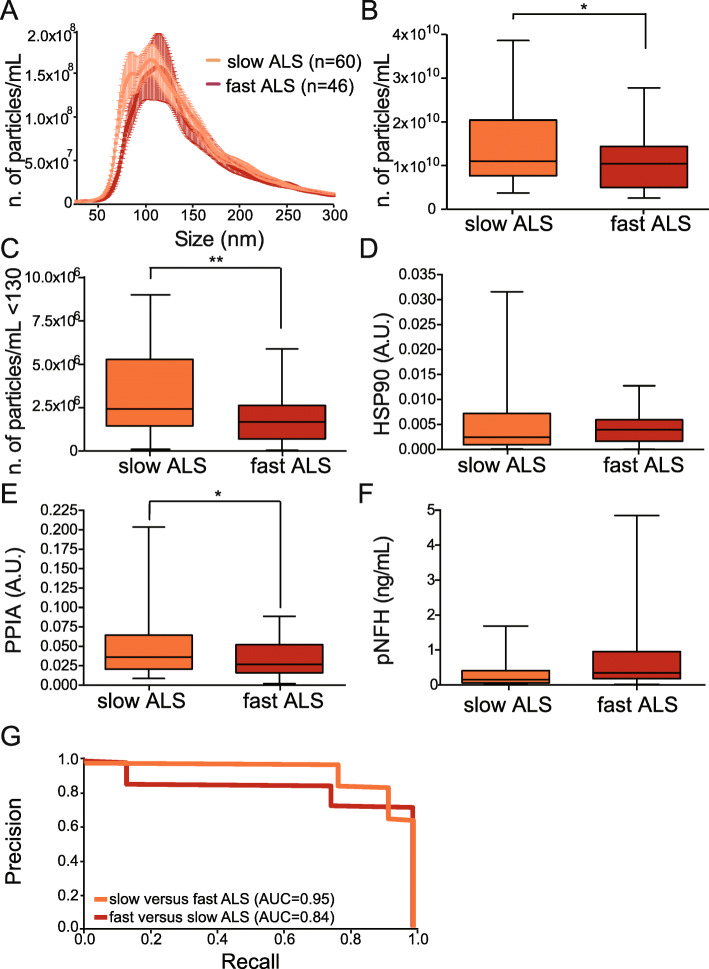
Fig. 7.
EV parameters distinguish fast and slow-ALS progressors. a Representative average curve of size distribution for slow and fast-ALS. b Numbers of particles per mL in slow and fast-ALS; Student t-test, *p = 0.017. c Number of particles per mL below 130 nm in slow and fast-ALS; Student t-test, **p = 0.0053. d Levels of HSP90 in slow and fast-ALS; Student t-test, p = 0.46. A.U.: arbitrary units. e Levels of PPIA in slow and fast-ALS; Student t-test, *p = 0.015. A.U.: arbitrary units. f Plasma levels of pNFH in slow and fast-ALS; Student’s t-test, p = 0.09. g Precision-recall curves on stratified data for ALS progression showing the AUC for each comparison

