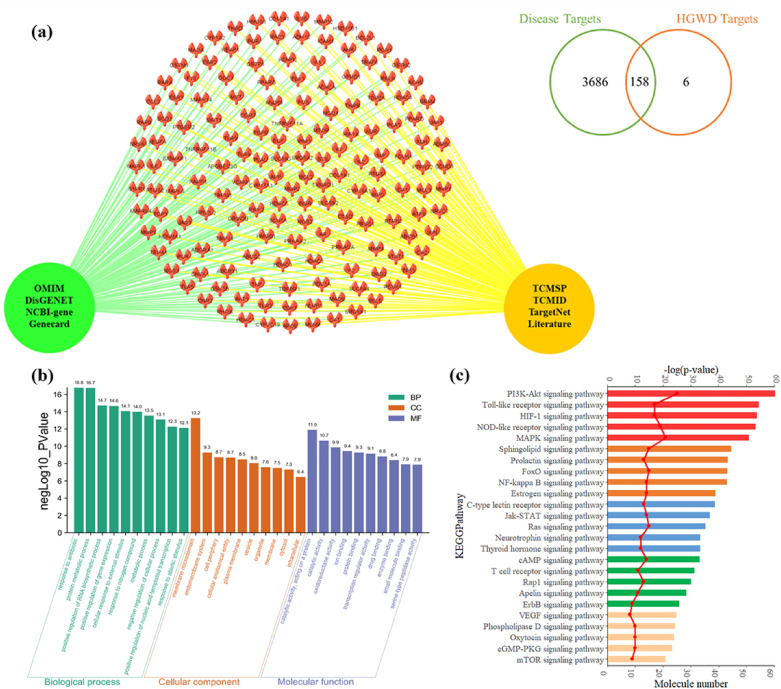
Fig. 7.
Target prediction of HGWD with GO and KEGG enrichment analysis. a The Venn diagram of disease targets and HGWD targets showed 158 key target proteins in the overlapping part, and the schematic diagram was displayed. b The top 10 significant terms respectively in GO biological process, cellular component and molecular function classification, and the order of importance was ranked from left to right by -log(p-value). c The top 25 significant terms in KEGG pathways enrichment. The molecule number of target genes enriched in the KEGG pathway was showed, and the order of importance was ranked from top to bottom by -log(p-value)

