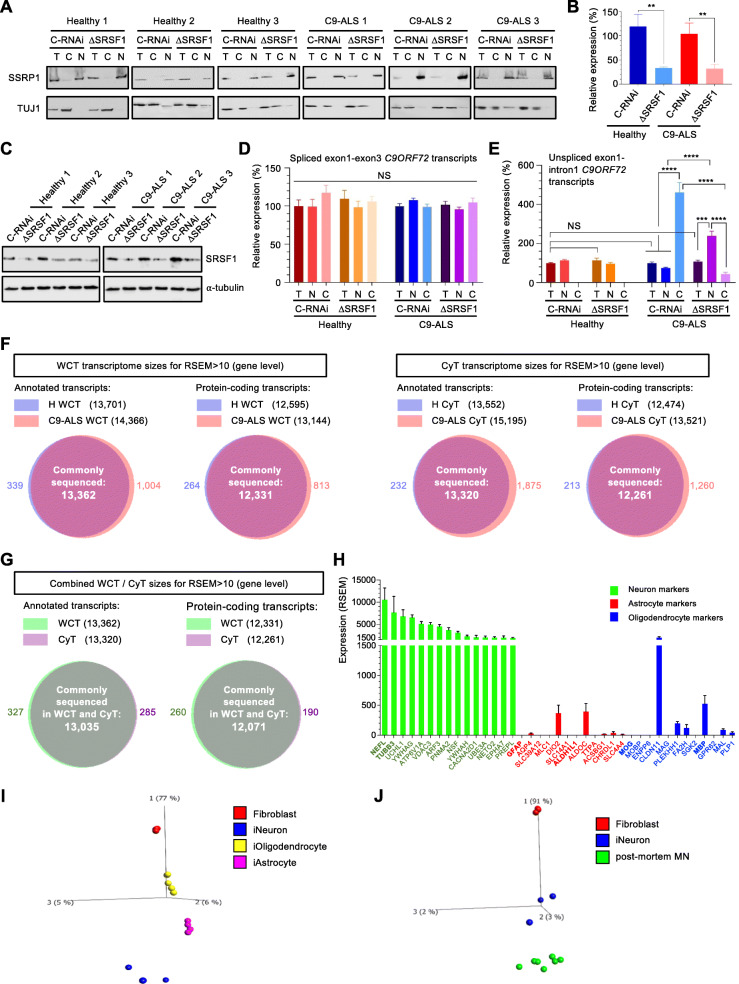
Fig. 1.
Generation of whole-cell and cytoplasmic transcriptomes from healthy and C9ORF72-ALS patient-derived neurons. A Three healthy control and three C9ORF72-ALS (C9-ALS) lines of patient-derived neurons were treated with Ctrl-RNAi (C-RNAi) or SRSF1-RNAi (ΔSRSF1) prior to whole-cell (T) lysis or nuclear (N) and cytoplasmic (C) fractionation. Western blots were probed for the nuclear chromatin remodelling SSRP1 factor and the neuronal cytoplasmic marker TUJ1. B Relative expression levels of SRSF1 mRNA in whole-cell patient-derived neurons prepared in A were quantified using qRT-PCR in biological triplicates following normalization to U1 snRNA levels and to 100% for healthy neurons treated with C-RNAi (mean ± SEM; one-way ANOVA with Tukey’s correction for multiple comparisons, **: p < 0.01; N (qRT-PCR reactions) = 3). C Western blots analysis of SRSF1 protein expression in the three healthy and three C9-ALS neuron lines treated with either C-RNAi or SRSF1-RNAi. D Total, nuclear and cytoplasmic levels of intron1-spliced C9ORF72 transcripts (as measured by the exon1-exon3 junction) were quantified using qRT-PCR in biological triplicates following normalization to U1 snRNA levels and to 100% for whole-cell healthy neurons treated with C-RNAi (mean ± SEM; one-way ANOVA with Tukey’s correction for multiple comparisons, NS: non-significant; N (qRT-PCR reactions) = 3). E Total, nuclear and cytoplasmic levels of unspliced C9ORF72 transcripts retaining intron1 (as measured by the exon1-intron1 junction) were quantified using qRT-PCR in biological triplicates following normalization to U1 snRNA levels and to 100% for whole-cell healthy neurons treated with C-RNAi (mean ± SEM; one-way ANOVA with Tukey’s correction for multiple comparisons, NS: non-significant; ***: p < 0.001; ****: p < 0.0001; N (qRT-PCR reactions) = 3). F Whole cell transcriptome (WCT; left) and cytoplasmic transcriptome (CyT, right) sizes for quantified transcripts at gene level. G Combined WCT and CyT sizes for quantified transcripts at gene level. H Abundance of neuron (green), astrocyte (red) and oligodendrocyte (blue) markers in the human derived neurons (combined from all 24 protein-coding transcriptomes shown in Fig. 1F). I Principal component analysis (PCA) plot representing transcriptomes from patient-derived neurons, astrocytes, oligodendrocytes and fibroblasts of origin. J Principal component analysis (PCA) plot representing transcriptomes from patient-derived neurons, human post-mortem motor neurons (MN) and fibroblasts of origin

