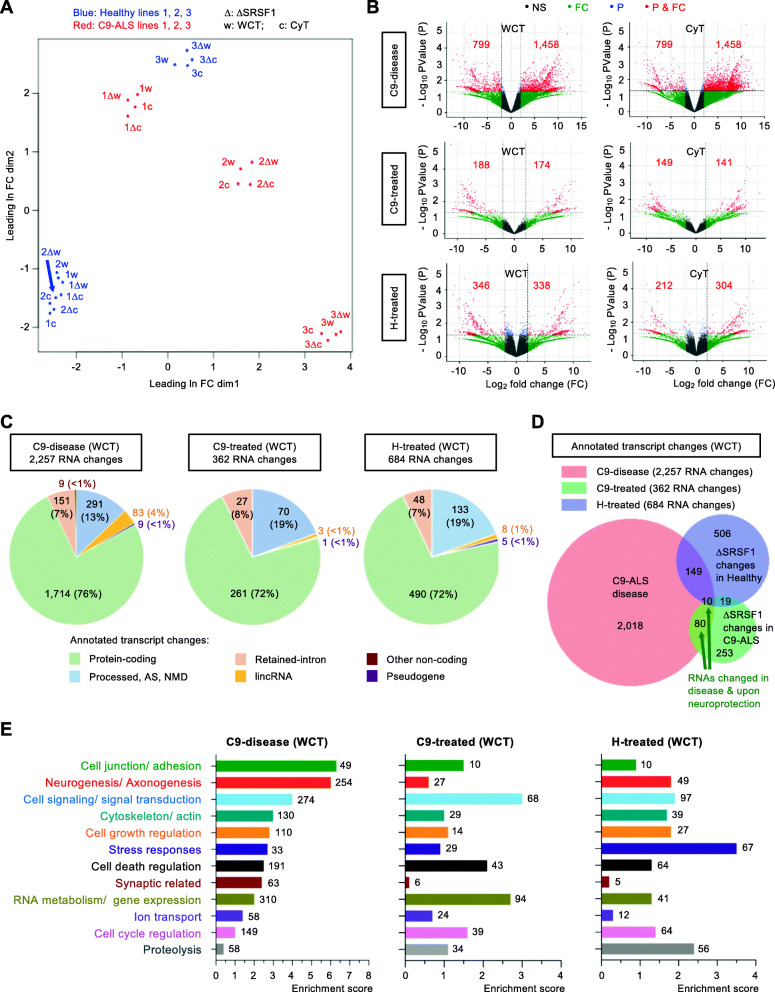
Fig. 2.
Genome-wide effects of the SRSF1 depletion in human healthy and C9ORF72-ALS neurons. A Multidimensional scale analysis of the WCT and CyT transcriptomes for healthy (blue) and C9-ALS (red) lines of patient-derived neurons treated with C-RNAi or SRSF1-RNAi (Δ). B Volcano plots representing the genome-wide distribution of differentially-expressed transcripts according to p-values and fold changes for C9-disease (H_C-RNAi versus C9_C-RNAi), C9-treated (C9_C-RNAi versus C9_SRSF1-RNAi) and H-treated (H_C-RNAi versus H_SRSF1-RNAi) neuron groups. NS: non-significant; FC: fold changes < 2; P: p-values > 0.05; P & FC: significant p-values (< 0.05) & fold changes (> 2). Red labels indicate the numbers of significantly down- or up- regulated annotated transcripts. C, D Venn diagrams representing differentially-expressed transcripts at WCT level for C9-disease, C9-treated and H-treated groups. E Bar charts representing enrichment scores for the 12 top biological processes identified via functional annotation clustering for the C9-disease group (1470 protein coding DEGs). The enrichment scores corresponding to the 12 altered biological pathways are also reported for the C9-treated (254 protein-coding DEGs) and H-treated groups (470 protein-coding DEGs). The GO terms are provided with gene IDs and statistics in Table S6. Numbers at bar extremities indicate the numbers of genes altered in each pathways. The neuroprotective depletion of SRSF1 mitigates most of the disease-altered pathways

