Fig. 3.
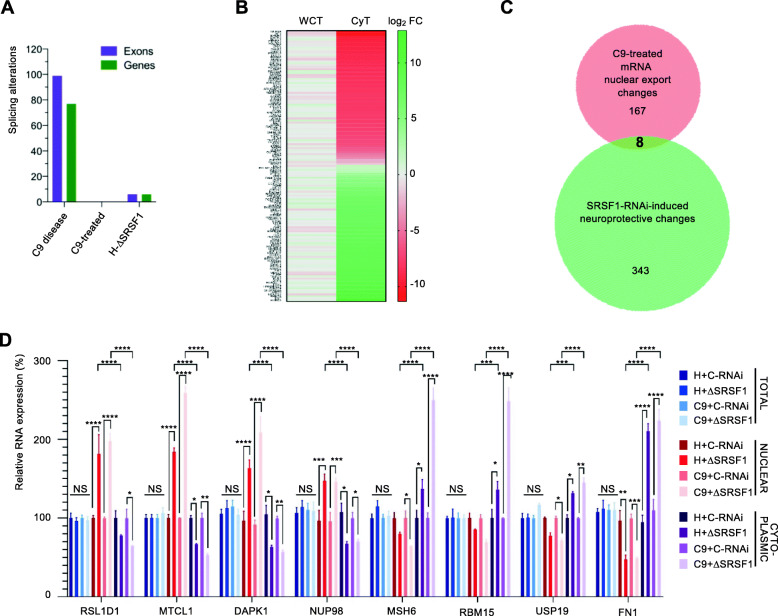
Genome-wide investigation of splicing and nuclear export in human neurons depleted of SRSF1. A Bar chart representing the genome-wide number of identified splicing alterations at exon (purple) or gene (green) level for the C9-ALS-disease, C9-ALS-treated and SRSF1-depleted healthy neurons. B Genome wide nuclear RNA export analysis of the SRSF1 depletion in C9-ALS patient-derived neurons. The heatmap represents transcript fold changes for FC > 3 in WCT and FC > 3 in CyT. Red labels shows down-regulated transcripts while green depicts upregulated transcripts. C Venn diagram comparing the lists of transcripts with altered RNA nuclear export and changed upon neuroprotection in C9-ALS neurons depleted for SRSF1. D Relative RNA expression levels of RSL1D1, MTCL1, DAPK1, NUP98, MSH6, RBM15, USP19 and FN1 transcripts in total, nuclear and cytoplasmic fractions were quantified using qRT-PCR in biological triplicates following normalization to U1 snRNA levels and to 100% for whole-cell healthy neurons treated with C-RNAi (mean ± SEM; two-way ANOVA with Tukey’s correction for multiple comparisons, NS: not significant; *: p < 0.05, **: p < 0.01, ***: p < 0.001; ****: p < 0.0001; N (qRT-PCR reactions) = 3)

