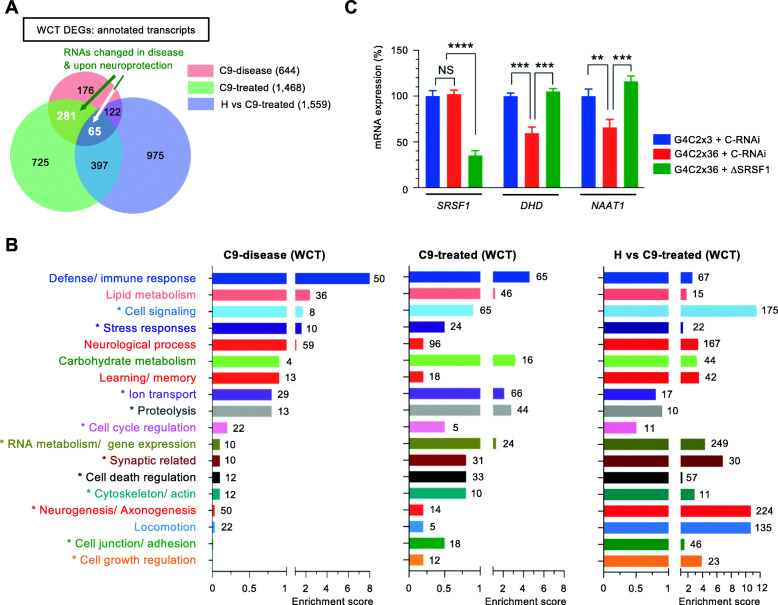
Fig. 4.
Genome-wide investigation of the partial depletion of SRSF1 in C9-disease and C9-treated Drosophila heads. A Venn diagram representing the numbers of annotated transcripts at gene level identified in the C9-disease (G4C2x3 + Ctrl-RNAi versus G4C2x36 + Ctrl-RNAi), C9-treated (G4C2x36 + Ctrl-RNAi versus G4C2x36 + SRSF1-RNAi) and H vs C9-treated (G4C2x3 + Ctrl-RNAi versus G4C2x36 + SRSF1-RNAi) groups. B Bar charts representing enrichment scores for biological processes identified via functional annotation clustering of the whole cell transcriptomes for the C9-disease (644 DEGs), C9-treated (1468 DEGs) and H vs C9-treated (1559 DEGs) groups. The GO terms are provided with gene IDs and statistics in Table S11. Numbers at bar extremities indicate the numbers of genes altered in each pathways. Modulated pathways annotated with an asterisk (*) were also identified in the human patient-derived neuron transcriptomes. The neuroprotective depletion of SRSF1 mitigates most of the disease-altered pathways. C Relative expression levels of SRSF1, DHD and NAAT1 mRNAs were quantified using qRT-PCR for the indicated Drosophila lines in biological triplicates following normalization to Tub84b mRNA levels and to 100% for G4C2x3 + C-RNAi Drosophila heads (mean ± SEM; one-way ANOVA with Tukey’s correction for multiple comparisons; **: p < 0.01, ***: p < 0.001, ****: p < 0.0001; N (qRT-PCR reactions) = 3)

