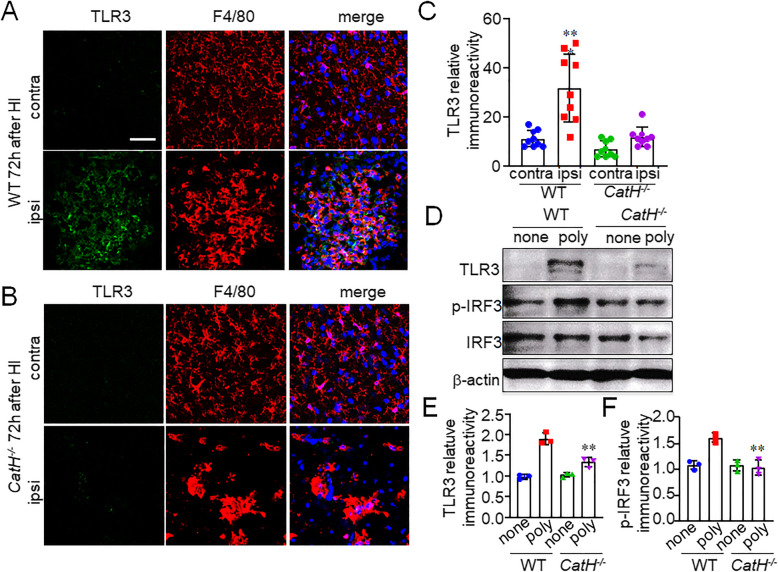
Fig. 3.
CatH deficiency prevents the increased expression of TLR3 in microglia/macrophages after HI. A, B CLSM images of TLR3 (green), F4/80 (red), and their merged images with overlay of Hoechst staining (blue) in the cortex of WT (A) and CatH−/− (B) mice 72 h after HI injury. Contra contralateral, ipsi ipsilateral. Scale bar, 50 μm. C The mean relative immunoreactivity for TLR3 in the pyramidal regions of the hippocampus of WT and CatH−/− mice. The columns and bars represent the mean ± SD (n = 9). The asterisks indicate a statistically significant difference from contra (**p < 0.01, one-way ANOVA test). D immunoblots show the full-length TLR3, p-IRF3, and IRF3 expression in splenocytes from WT and CatH−/− mice 48 h after treatment with 10 μg/ml poly(I:C). E, F The quantitative analyses of TLR3 (E) and p-IRF3 (F) in the immunoblots in (D). The columns and bars represent the mean ± SD (n = 3). The asterisks indicate a statistically significant difference from WT poly group value (**p < 0.01, one-way ANOVA test)

