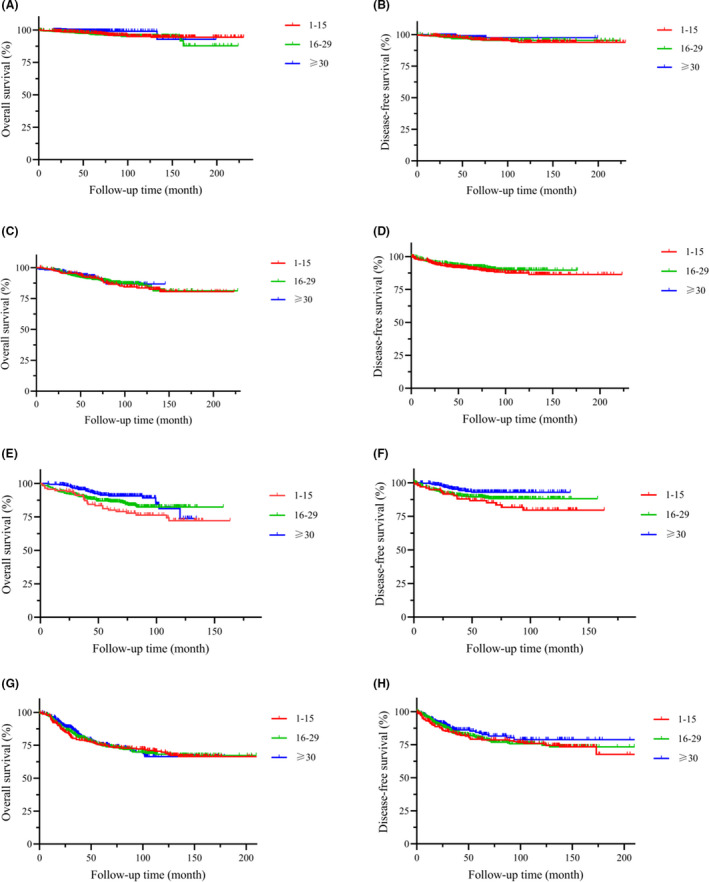
FIGURE 4.

OS and DFS of pN0 patients in different ELN groups. A, OS of pT1 and pTis patients, P = .156. B, DFS of pT1 and pTis patients, P = .927. C, OS of pT2 patients, P = .930. D, DFS of pT2 patients, P = .154. E, OS of pT3 patients, P = .031. F, DFS of pT3 patients, P = .019. G, OS of pT4 patients, P = .970. H, DFS of pT4 patients, P = .458
