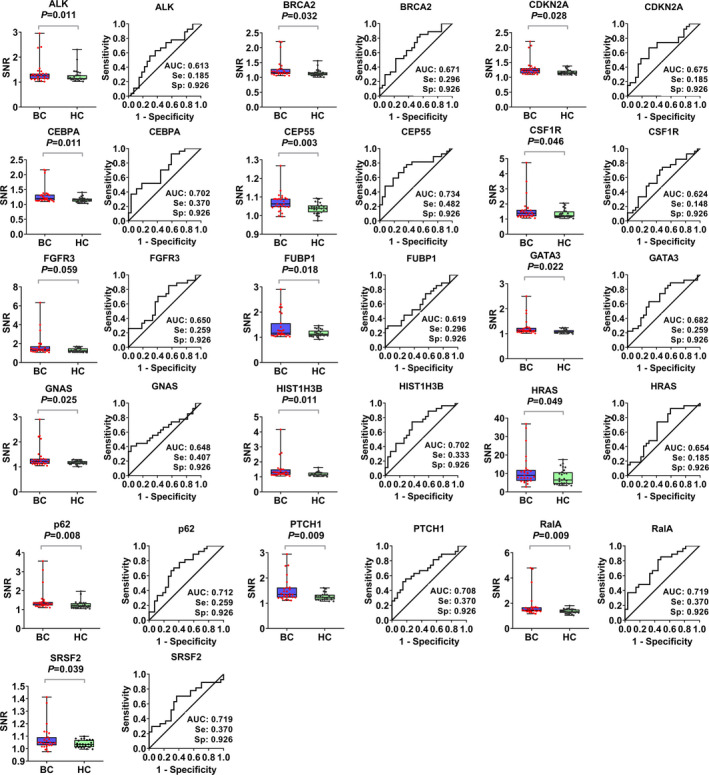
FIGURE 2.

The signal to noise ratio (SNR) values and receiver operating characteristic (ROC) curves of 16 candidate tumor‐associated autoantibodies (TAAbs). For the scanned signal of protein microarrays, the median of foreground (F Median) and background (B Median) intensity of each protein was measured. The SNR (F median/B median) value was defined to control the background values between different samples. BC, breast cancer; HC, healthy controls. Se, sesitivity; Sp, specificity.
