
FIGURE 3.
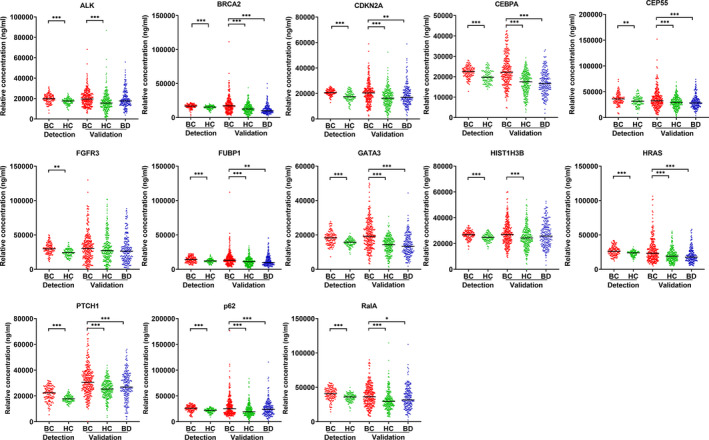
The relative concentration of individual tumor‐associated autoantibodies (TAAbs) among breast cancer, benign breast disease, and normal individuals in two datasets (TAAb detection set and TAAb validation set). BC, breast cancer; BD, benign breast disease; HC, healthy controls; TAAb, tumor‐associated autoantibodies. * P < .05, ** P < .01, *** P < .001 (Kruskal‐Wallis H test and Mann‐Whitney U test, Bonferroni correction)