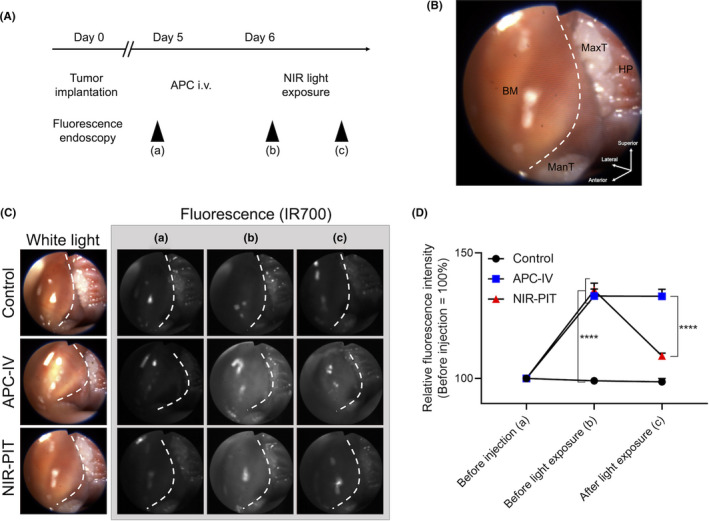
FIGURE 3.

Quantitative fluorescence analysis during the endoscopic NIR‐PIT. A, Treatment and imaging schedule. B, Orientation of white light image. Right buccal region was observed. BM, buccal mucosa; HP, hard palatine; ManT, mandibular teeth; MaxT, maxillary teeth. White dotted line represents the outline of the tumor. C, The representative image of each experimental group at each observed time point. White dotted line represents the outline of the tumor. D, Relative fluorescence intensity was calculated from the mean fluorescence intensity of the tumor (n = 10; repeated measures two‐way ANOVA followed by Tukey test; ****P < .0001)
