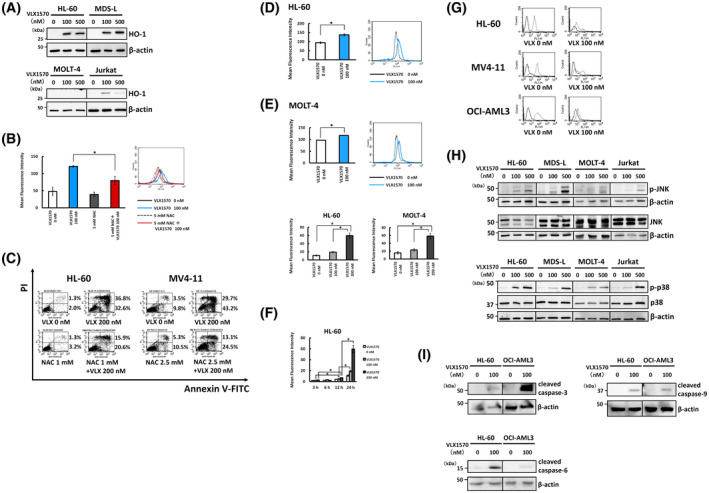
FIGURE 4.

VLX1570 induces ROS generation. (A) HL‐60, MDS‐L, MOLT‐4, and Jurkat cells were treated with indicated doses of VLX1570 for 6 h and the cell lysates were analyzed by immunoblotting analysis for detection of HO‐1. (B) HL‐60 cells were treated with or without 100 nmol/L of VLX1570 or 5 mmol/L of NAC for 3 h and stained with 0.1 μmol/L of CM‐H2DCFDA for 30 min at 37℃. ROS levels were determined by flow cytometry. (C) HL‐60 and MV4‐11 cells were treated with VLX1570 in the absence or presence of NAC for 24 h. The treated cells were stained by Annexin V‐FITC/PI and analyzed by flow cytometry. (D) HL‐60 and MOLT‐4 cells were treated with or without 100 nmol/L of VLX1570 for 3 h and stained with 10 μmol/L of HPF for 30 min at 37℃. ROS levels were determined by flow cytometry. (E) HL‐60 and MOLT‐4 cells were treated with or without indicated doses of VLX1570 for 24 h and stained with 0.2 μmol/L of HYDROPTM for 30 min at 37℃. ROS levels were determined by flow cytometry. (F) HL‐60 and MOLT‐4 cells were treated with or without indicated doses of VLX1570 for the indicated times and stained with 0.2 μmol/L of HYDROPTM for 30 min at 37℃. ROS levels were determined by flow cytometry. (G) HL‐60, MV4‐11, and OCI‐AML3 cells were exposed to 100 nmol/L of VLX1570 for 24 h. Mitochondrial membrane potential was detected by rhodamine 123 staining and flow cytometry. Solid line, negative control; dotted line, cells treated with rhodamine 123. (H) HL‐60, MDS‐L, MOLT‐4, and Jurkat cells were treated with indicated doses of VLX1570 for 3 h and the cell lysates were analyzed by immunoblotting analysis for detection of JNK, phospho‐JNK, p38, and phospho‐p38. β‐actin was used as a loading control. (I) HL‐60 and OCI‐AML3 cells were treated with indicated doses of VLX1570 for 12 h and the cell lysates were analyzed by immunoblotting analysis for detection of cleaved caspase‐3, ‐6, and ‐9. β‐actin was used as a loading control. In B, D, E, F, statistical differences were evaluated and presented by asterisks if P values were less than .05
