
FIGURE 5.
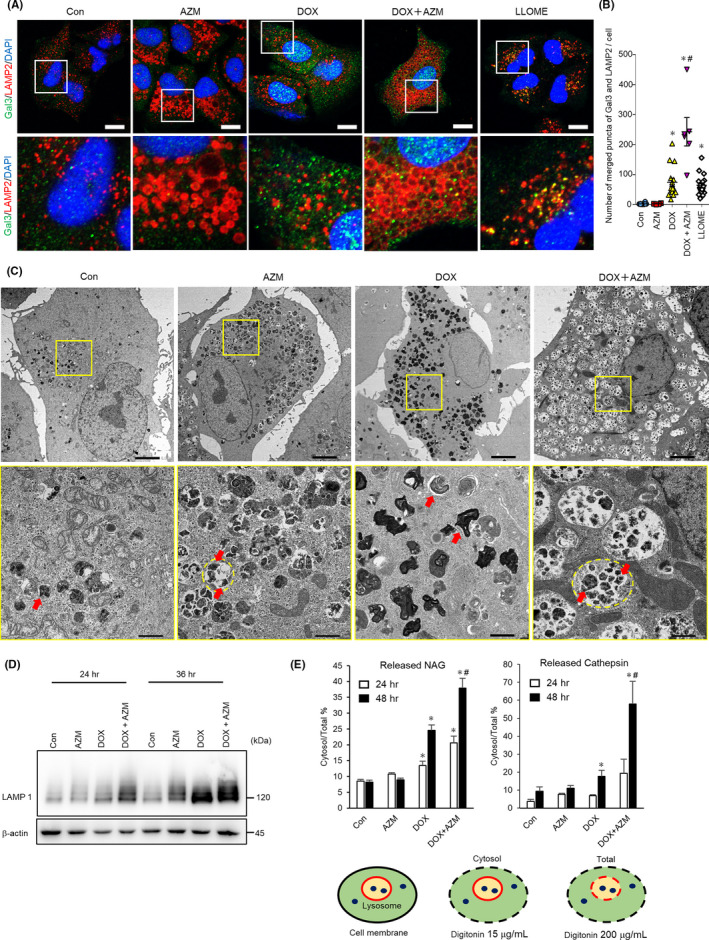
Coadministration of azithromycin (AZM) enhanced doxorubicin (DOX)‐induced lysosomal membrane permeabilization in A549 cells. A, Colocalization of Gal3 and LAMP2 was assessed by immunofluorescent staining and confocal microscopic observation. A549 cells were treated with DOX (1 µM) ± AZM (25 µM) for 48 h and then stained for Gal3 (Green), LAMP2 (Red), and nuclei (blue) with DAPI. A549 cells treated with LLOMe (1 mM) for 4 h were used as positive control. Scale bar = 10 µm. The boxed area was enlarged in the bottom panels. B, Colocalized signals of LAMP2 and Gal3 were calculated and summarized. n for Con, AZM, DOX, and DOX + AZM are 14, 4, 15, and 6, respectively, bar = mean ± SE, *P < .05 vs control, #P < .05 vs DOX. C, A549 cells treated with DOX (1 µM) ± AZM (25 µM) for 48 h were observed with transmission electron microscopy. Scale bar = 5 µm for top panels. The enlarged images of the boxed area are shown below. Red arrows indicate lysosomes and a yellow dashed line indicates autolysosome. Scale bar = 1 µm for bottom panels. D, LAMP1 expression level assessed by western blotting. A549 cells were treated with indicated reagents for 24 or 36 h. E, Lysosomal membrane permeabilization (LMP) was measured by assessing the ratio of cytosolic β‐N‐acetyl‐glucosaminidase (NAG) or cathepsin activity per total cellular activity. A549 cells were treated with DOX (1 µM) ± AZM (25 µM) for 24 or 48 h, and then LMP was assessed. Representative data of three independent experiments are shown. n = 4, bar = mean ± SD, *P < .05 vs control, #P < .05 vs DOX. At the bottom, a schema of this experiment is shown. Plasma membrane and lysosomal membrane are shown in black and red, respectively. Lysosomal enzymes are shown in blue dots. Different concentrations of digitonin permeabilized different membranes are shown with a dashed line