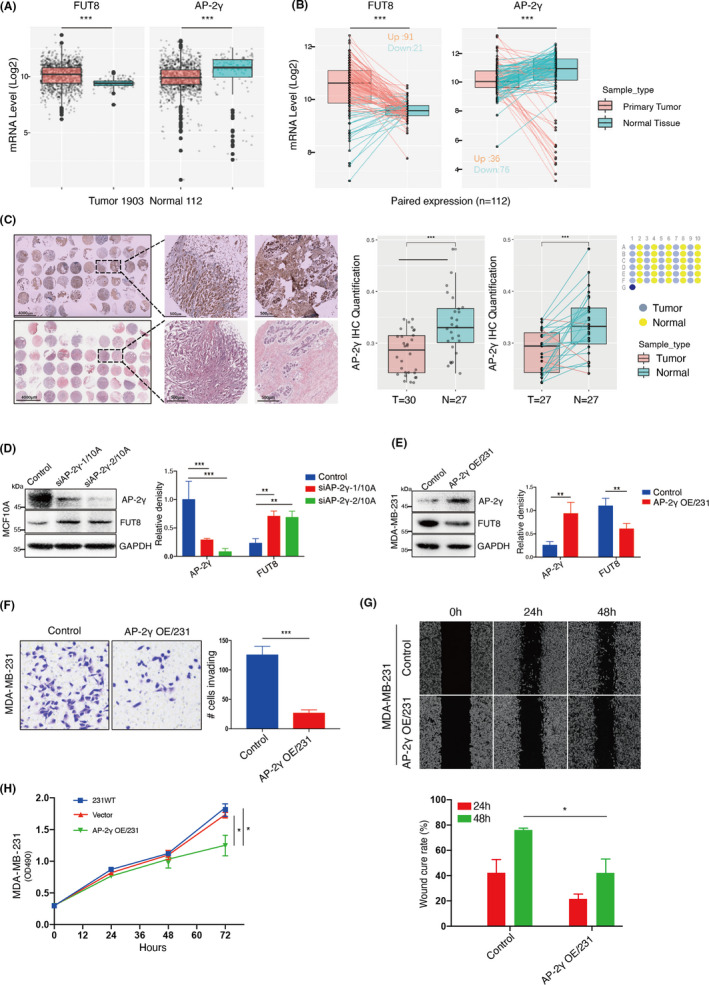
FIGURE 5.

Correlation between AP‐2γ and fucosyltransferase 8 (FUT8) expression in BC. A, mRNA expression of FUT8 and AP‐2γ in normal breast tissues and breast cancer (BC) tissues in The Cancer Genome Atlas (TCGA) database. B, mRNA expression of FUT8 and AP‐2γ in 112 adjacent normal and paired BC tissues in TCGA database. C, Differential AP‐2γ expression of BC tissues in tissue microarray (TMA). D, MCF‐10A lines stably transfected with lentivirus carrying one of two independent short hairpin RNAs (shRNAs) targeting AP‐2γ (siAP‐2γ‐1/10A, siAP‐2γ‐2/10A), or nontargeting control (Control). AP‐2γ and FUT8 levels were assessed by Western blotting. Right panel shows quantitation. E, AP‐2γ and FUT8 levels in AP‐2γ–stable transfectant of MDA‐MB‐231 (AP‐2γ OE/231) and vector blank (control). Right panel shows quantitation. Transwell invasion assay (F), scratch‐wound assay (G), and proliferation (H) of AP‐2γ–overexpressing MDA‐MB‐231
