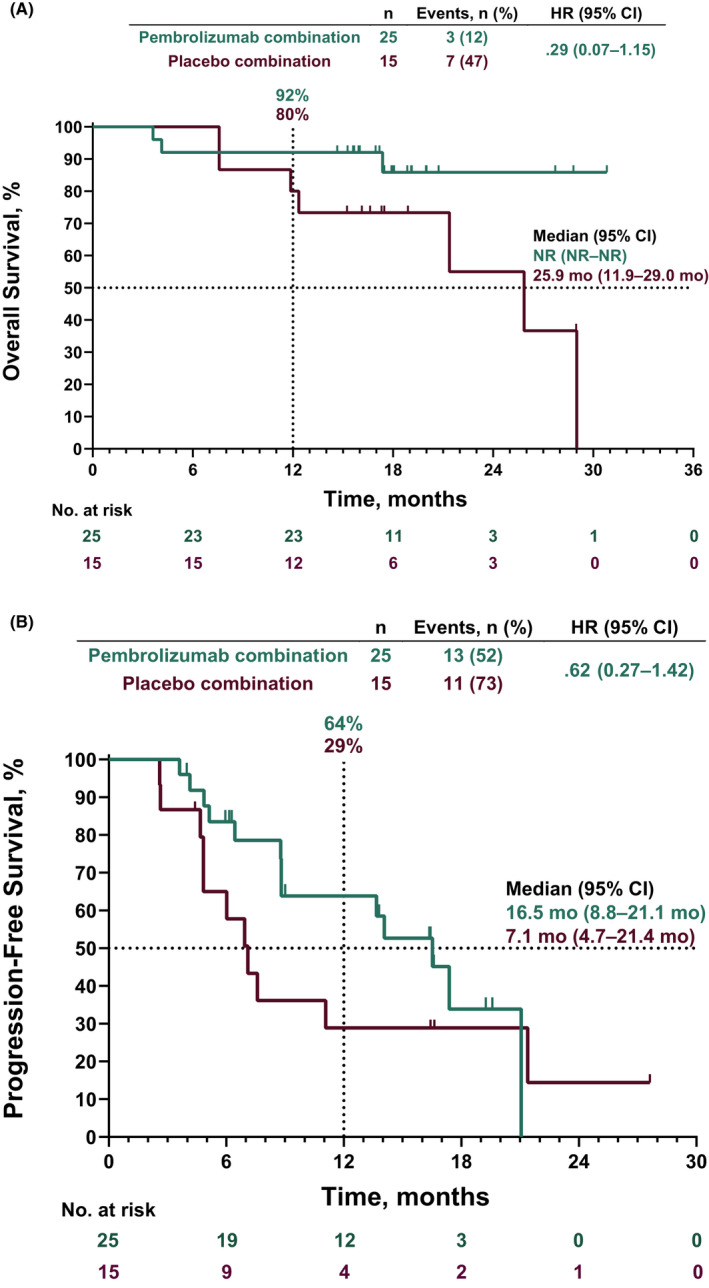
FIGURE 2.

Kaplan‐Meier analysis of (A) OS and (B) PFS in the intent‐to‐treat population. HR, hazard ratio; NR, not reached; OS, overall survival; PFS, progression‐free survival

Kaplan‐Meier analysis of (A) OS and (B) PFS in the intent‐to‐treat population. HR, hazard ratio; NR, not reached; OS, overall survival; PFS, progression‐free survival