FIGURE 3.

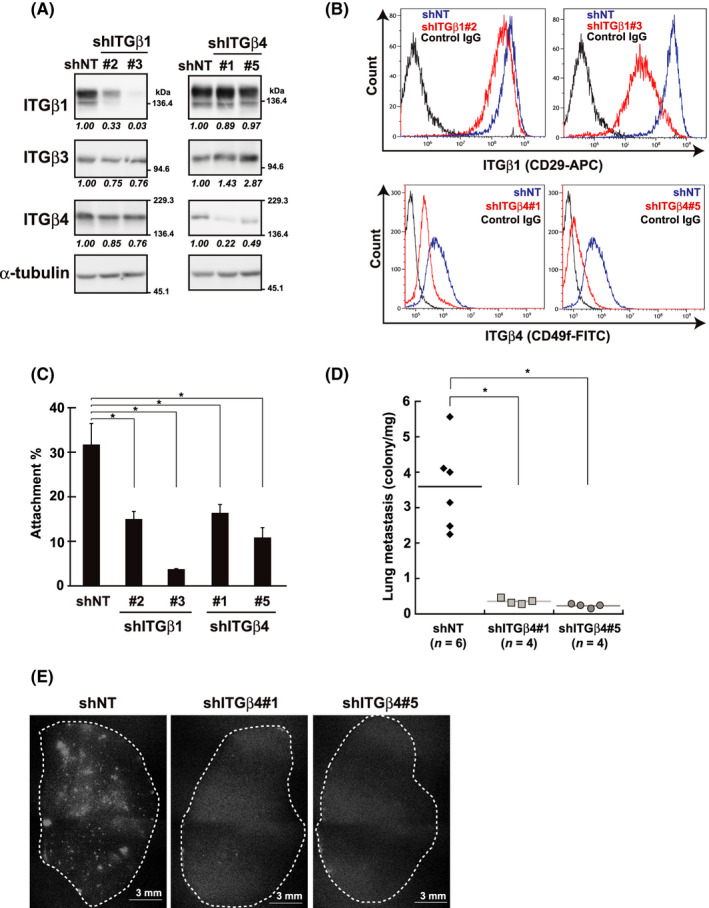
Knockdown of β1 and β4 integrin (ITG) expression and its impact on RA and lung metastasis. shRNA [shITGβ1#2, #3, shITGβ4#1, #5 and control (shNT)]‐expressing cells were established from non‐ (A‐C) or tdTomato‐labeled MDA‐MB‐231 cells (D, E) (see Materials and Methods). Knockdown effects were verified by western blotting (A) and flow cytometry (B) using the indicated antibodies. A, α‐Tubulin was used as the loading control. The band intensities were quantified, normalized with those of α‐tubulin, and shown as relative to the control (shNT) below the panels. B, Representative histograms are shown. C, RA of shRNA‐expressing cells was evaluated using the cell attachment assay on Matrigel‐coated dishes as A0/A* in Figure 1D. Values represent mean ± SD from at least 3 independent experiments. *P < .01. D, E, Cells were inoculated into the mammary fat pads of female NOD/SCID mice. When the tumor volume reached approximately 1.0 cm3, the metastatic nodules in the lobes of the lungs—representative images are shown (E)—were quantified and plotted as described in the Materials and Methods (D). Horizontal lines indicate the means from the indicated number of mice. *P < .01
