
FIGURE 4.
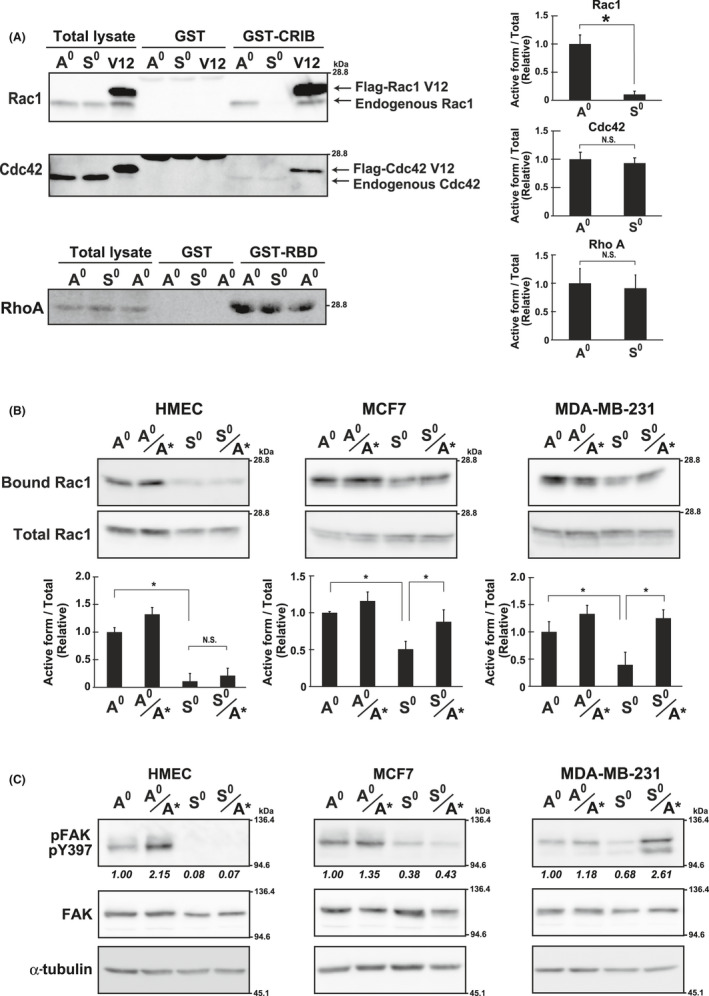
Rac1 activity under adherent and non‐adherent conditions. A, Rac1 and Cdc42, were precipitated with GST‐CRIB and RhoA with GST‐RBD, and analyzed by western blotting in HMECs cultured under adherent (A0) or non‐adherent (S0) conditions (Figure 1A). The Flag‐tagged constitutively active mutant of Rac1 and Cdc42 (Rac1 V12 and Cdc42 V12, respectively) were expressed in HMECs and used as the positive control (V12). The band intensities of the active forms (GST‐CRIB or GST‐RBD) were quantified using ImageJ software, normalized against those of the total lysate, and shown as relative to the control (A0) in graphs. B, Cells cultured as A0 and S0 or reattached as A0/A* and S0/S* (Figure 1A) for 1 h on Matrigel‐coated plates were used for pull‐down assays and analyzed as in (A). Values represent mean ± SD from at least 3 independent experiments. *P < .01. NS, not significant. C, Cells, cultured as in (B), were examined by western blotting using the indicated antibodies. α‐Tubulin was used as the loading control. The band intensities of pFAK were quantified, normalized with those of FAK, and shown as relative to the control (A0) below the panel of pFAK