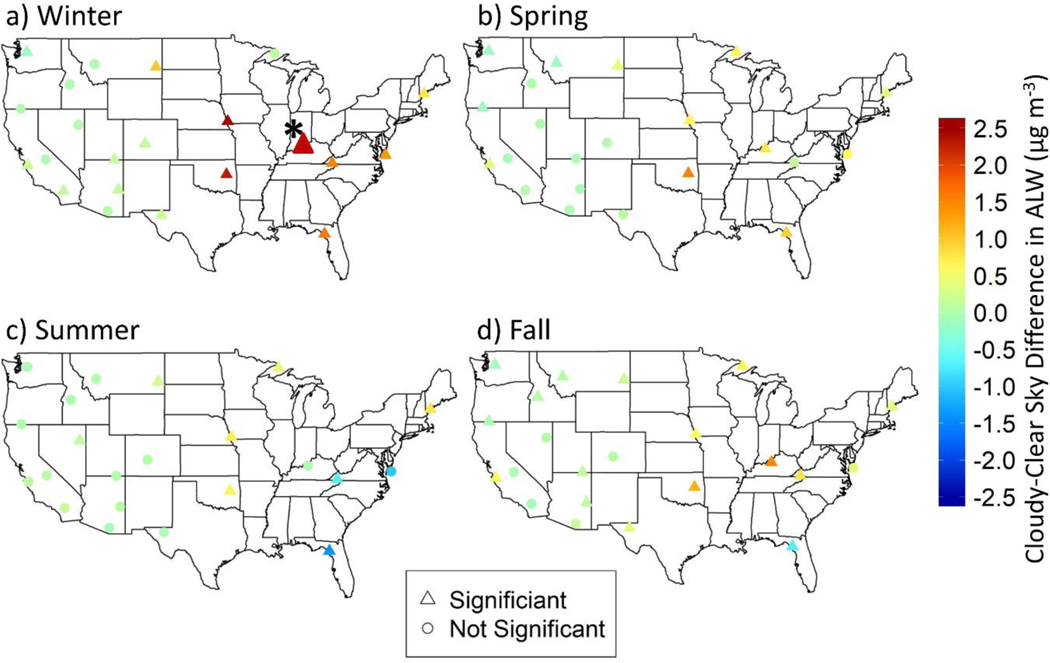
Figure 2.
Maps of the difference in ALW mass concentration medians (Cloudy-Clear Sky) for all regions from 2010–2014 for a) winter, b) spring, c) summer, and d) fall. The color of the point corresponds to the magnitude of the difference. Triangles indicate that median differences are significant by the Mann-Whitney U Test. Note that the difference in wintertime medians for daily ALW concentrations in the Ohio River Valley (denoted with asterisk) is substantially larger than other regions (Cloudy median value is 4.58 μg m−3 larger than Clear Sky).

