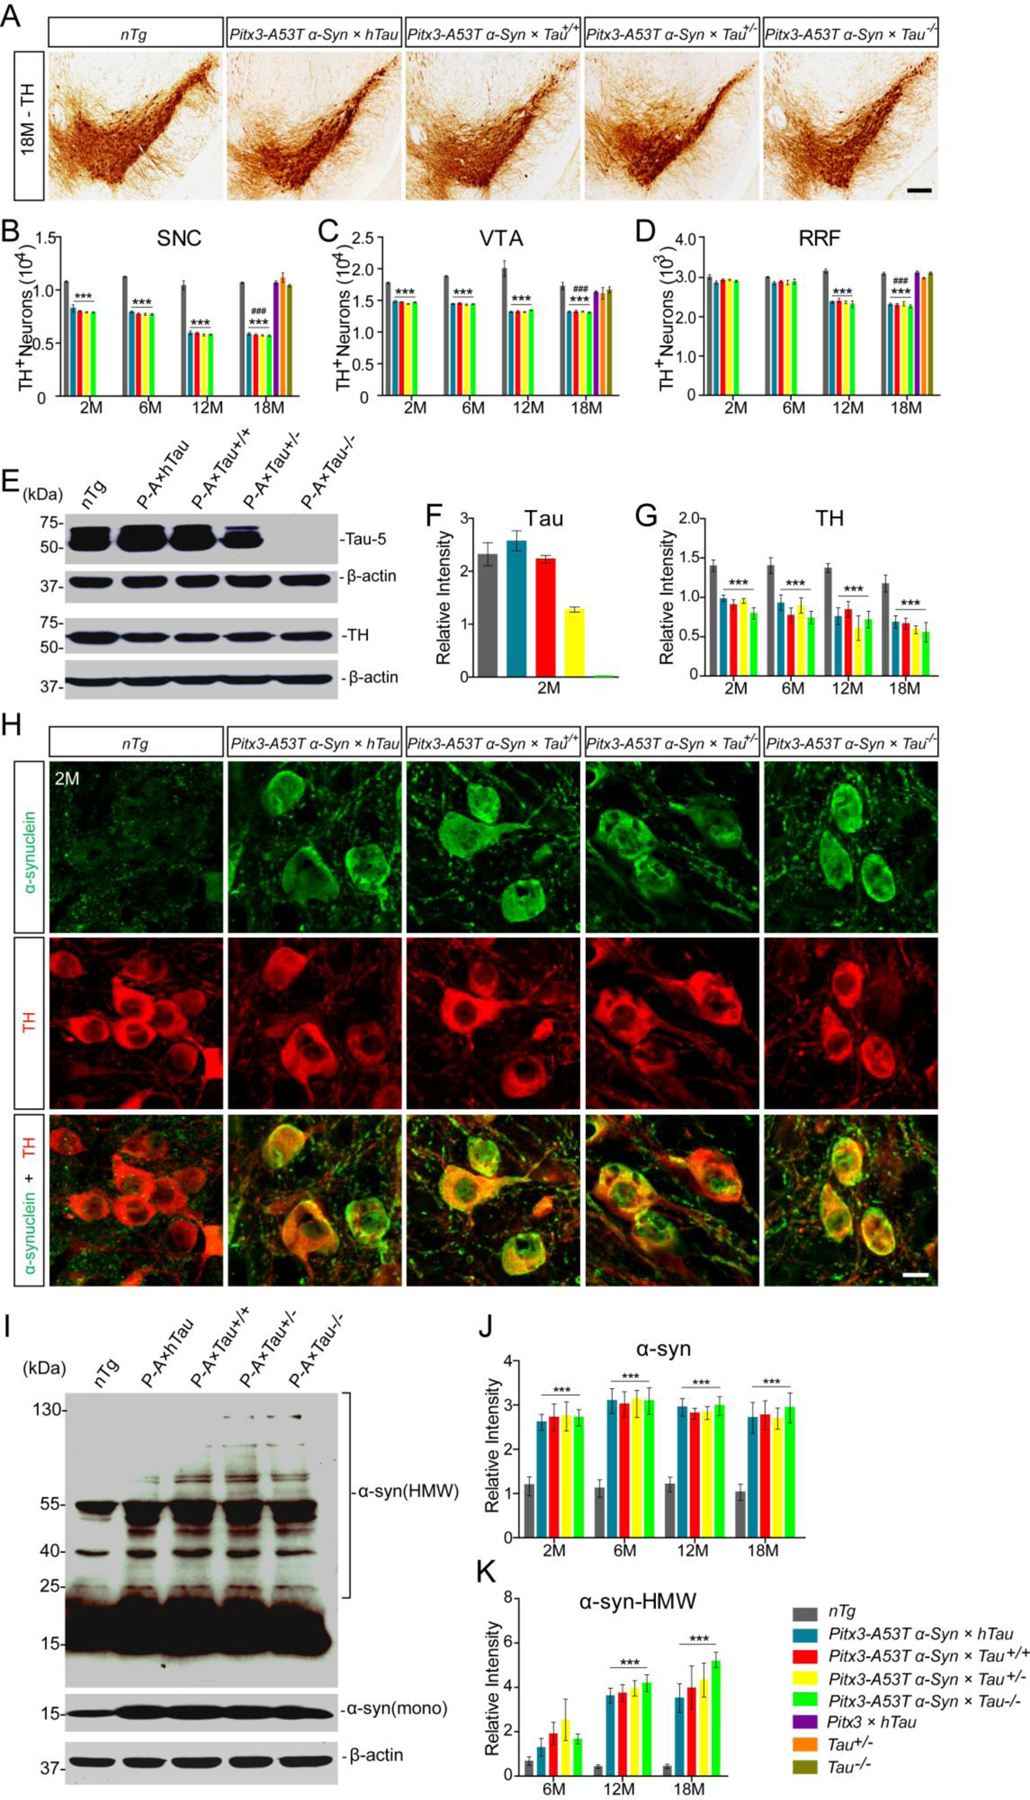
Figure. 2.

The effects of tau on A53T α-syn-mediated mDANs degeneration and α-syn aggregation. (A) TH immunohistochemistry staining of the midbrain coronal sections of mice. Scale bar: 100 μm. (B-D) The numbers of TH+ neurons in the SNC (B), VTA (C), and RRF (D) of mice. (E) Western blot showed the expression levels of tau and TH in midbrains of 2-month-old mice. (F,G) Bar graphs quantified the levels of tau and TH in midbrain homogenates, respectively. (H) Immunofluorescent images showed α-syn staining (green) in the mDANs (red) at SNC regions of 2-month-old mice. Scale bar: 10 μm. (I) Western blot showed the expression levels of α-syn-positive HMW aggregates in midbrains of 12-month-old mice. (J) Bar graph quantified the levels of total α-syn in midbrain homogenates. (K) Bar graph quantified the levels of α-syn-positive HMW aggregates in midbrain homogenates. n = 5 per genotype per time point. Values are mean±SEM. ***P < 0.001 (Triple transgenic versus age-matched nTg); ###P < 0.001 (Triple transgenic versus age-matched Pitx3 × hTau, Tau+/− and Tau−/−).
