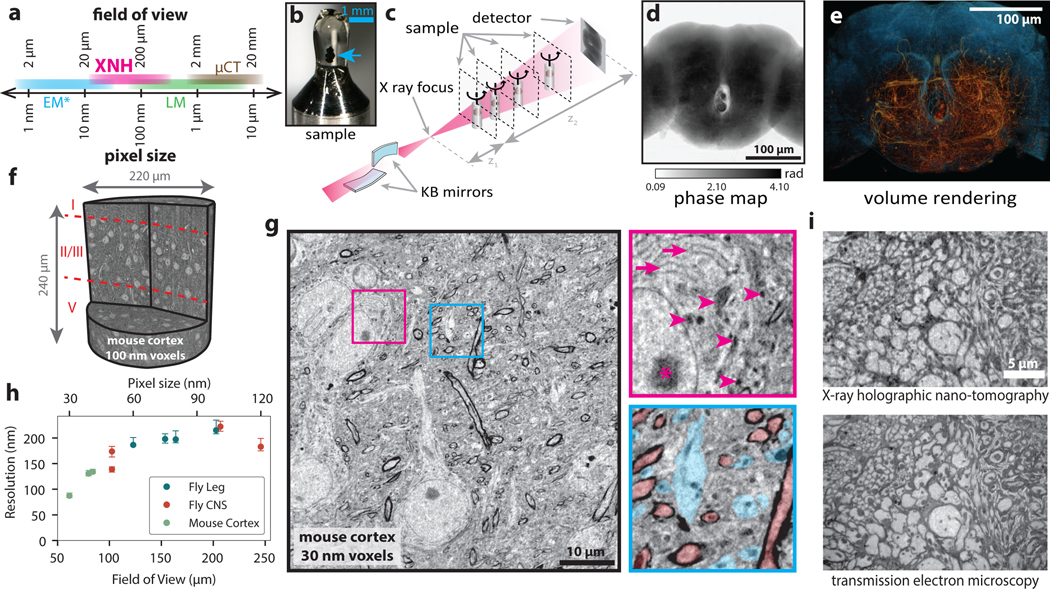
Figure 1: X-ray Holographic Nano-Tomography (XNH) Technique and Characterization.
(a) Schematic depicting pixel and FOV sizes for XNH imaging, along with comparisons to other modalities (assumes a 4 Mpixel detector). Note that EM imaging is generally performed on thin sections or surfaces, while XNH, LM, and micro computed tomography (μCT) can penetrate thicker tissue samples. (b) A Drosophila brain (blue arrow) embedded in resin and mounted for XNH imaging. (c) Imaging setup: the X-ray beam is focused to a spot using two Kirkpatrick-Baez mirrors and traverses the sample before hitting the detector. Holographic projections of the sample (a result of free-space propagation of the coherent X-ray beam) are recorded for each angle as the sample is rotated over 180° (see Extended Data Fig. 1a, Methods) (d) Phase map of the sample shown in Fig. 1b, calculated by computationally combining holograms recorded at 4 different distances from the beam focus. Computed pixel values indicate phase in radians. (e) 3D rendering of XNH volume of the central fly brain (120 nm voxels). The tissue outline is shown in blue, while neurons are highlighted in orange. (f) 3D rendering of an XNH volume of mouse posterior parietal cortex (100 nm voxels). Boundaries between cortical layers are shown in red. (g) Virtual slice through a higher-resolution XNH volume of mouse primary somatosensory cortex (30 nm voxels). Insets: detailed views showing ultrastructural features including mitochondria (magenta arrowheads), endoplasmic reticulum (magenta arrows), nucleolus (magenta asterisk), large dendrites (cyan) and myelinated axons (red). Insets are 10 μm in width. (h) Measured resolution (obtained using Fourier Shell Correlation, see Methods, Supplementary Table 1) for different XNH scans plotted as a function of voxel size and FOV. Datapoints and error bars show mean ± IQR of subvolumes sampled from each XNH scan. Number of subvolumes used for each scan is shown in Supplementary Data Table 1. (i) Comparison of XNH (50 nm voxels) and transmission electron microscopy (12 nm pixels, 100 nm section thickness) images of the same sample, the prothoracic leg nerve of an adult Drosophila.

