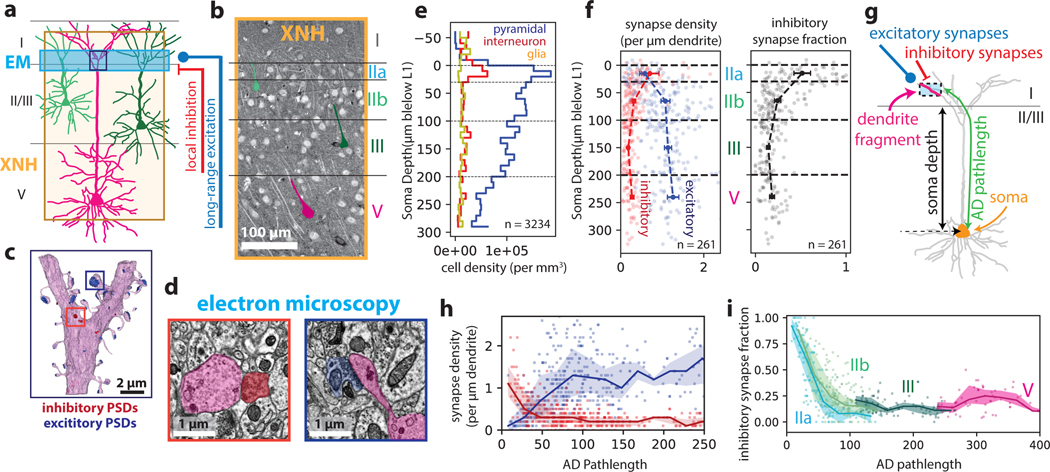
Figure 2: Correlative XNH - EM analysis of the connectivity statistics of pyramidal apical dendrites in posterior parietal cortex (PPC).
(a) Experimental approach: XNH imaging covers superficial and deep layers of PPC with sufficient resolution to resolve cell bodies and apical dendrites (ADs). Targeted 3D EM volume captures the layer I/II interface region, enabling analysis of synaptic inputs onto the apical dendrites near their initial bifurcations. (b) Virtual slice of XNH data (4 μm coronal section, max projection). Cell somata and apical dendrites are visible. Example layer II/III (green) and V (magenta) pyramidal cells are highlighted. (c) 3D EM reconstruction of an AD bifurcation with excitatory (targeting spines, blue) and inhibitory (targeting shafts or spine necks, red) synaptic inputs. (d) Example EM images of inhibitory (red) and excitatory (blue) synapses onto the apical dendrite. (e) Density of cell somata as a function of soma depth (μm below the layer I/II interface), classified as excitatory pyramidal cells (blue), inhibitory interneurons (red) or glia (yellow) (see Extended Data Fig. 2c). The top of layer II (~30 μm) contains a high density of both excitatory and inhibitory neurons. n = 3234 neurons. (f) Left: Synapse density plotted as a function of soma depth (μm below the layer I/II boundary). Excitatory and inhibitory synapses densities shown in blue and red, respectively. Right: Inhibitory synapse fraction plotted as a function of soma depth. Small markers correspond to one neuron. Large markers and error bars indicate mean and 95% confidence interval for each layer calculated via bootstrap analysis. n = 39, 99, 75, 38 neurons for layer IIa, IIb, III and V, respectively. (g) Schematic of dendrite-fragment connectivity analysis. Apical dendrites within the EM volume were divided into fragments 10 μm in length. For each fragment, the density of synapses was recorded along with the pathlength distance from the soma (AD pathlength). (h) Synapse densities (excitatory in blue, inhibitory in red) plotted as a function of pathlength to soma. Each marker corresponds to a 10 μm-long dendrite fragment. Lines and shaded areas indicate binned average (20 μm bins) and interquartile range. (i) Inhibitory synapse fraction plotted as a function of pathlength to soma. Each marker corresponds to one dendrite fragment, colored based on soma type. Lines and shaded areas indicate binned average and interquartile range (mean ± SE) for each soma type.

