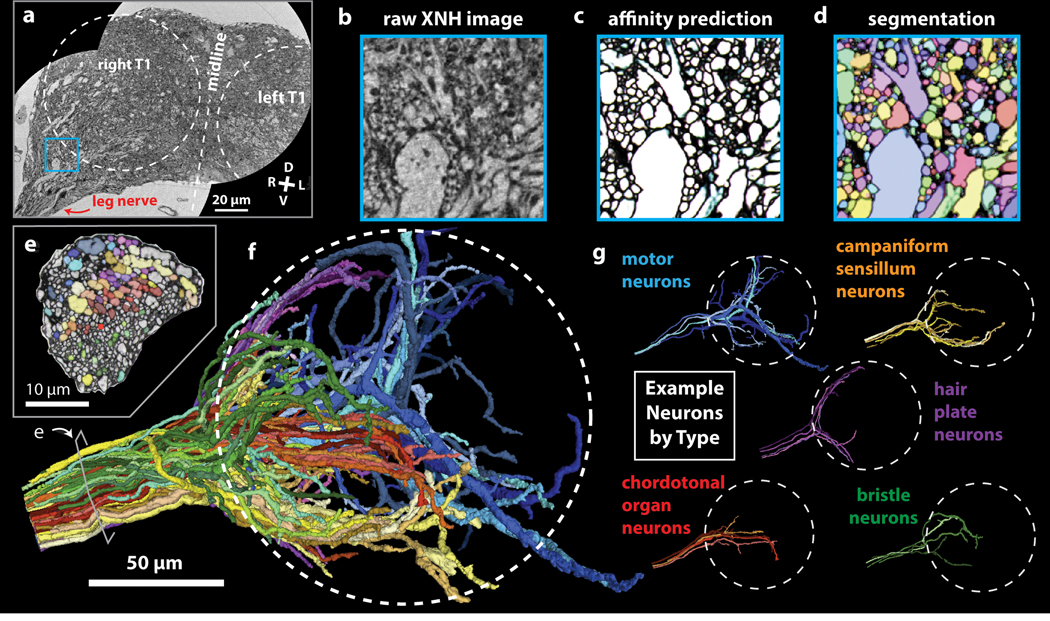
Figure 4: Automated Segmentation of Neuronal Morphologies using Convolutional Neural Networks (CNNs).
(a-b) Raw XNH image data, recorded from the T1 neuromeres of an adult Drosophila VNC. V, ventral; D, dorsal; R, right; L, left. (c) Predicted affinities output by a 3D U-NET (Extended Data Figure 4b) corresponding to the region shown in (b). The affinities quantify how likely it is that each voxel is part of the same neuron as neighboring voxels in z, y and x directions (plotted as RGB). In isotropic XNH data, affinities in different cardinal directions are usually similar, leading to images that appear mostly grayscale. The dark (low affinity) voxels are the basis for membrane predictions. (d) Segmentation corresponding to data shown in (b) and affinities shown in (c). Each neuron is agglomerated into a 3D morphology based on the affinities. In this visualization, each neuron has a unique color. (e) Cross-section of the main leg nerve showing motor and sensory axons reconstructed via automated segmentation. Coloring corresponds to neuron type, revealing spatial organization of neurons within the nerve. (f) 3D visualization of 100 automatically segmented neurons in the Drosophila VNC. Coloring corresponds to neuron types determined based on 3D morphology. Dotted circle indicates boundary of the T1 neuropil associated with control of the front leg. (g) Example morphologies of VNC neuron subclasses (only four example neurons per type shown for clarity).

