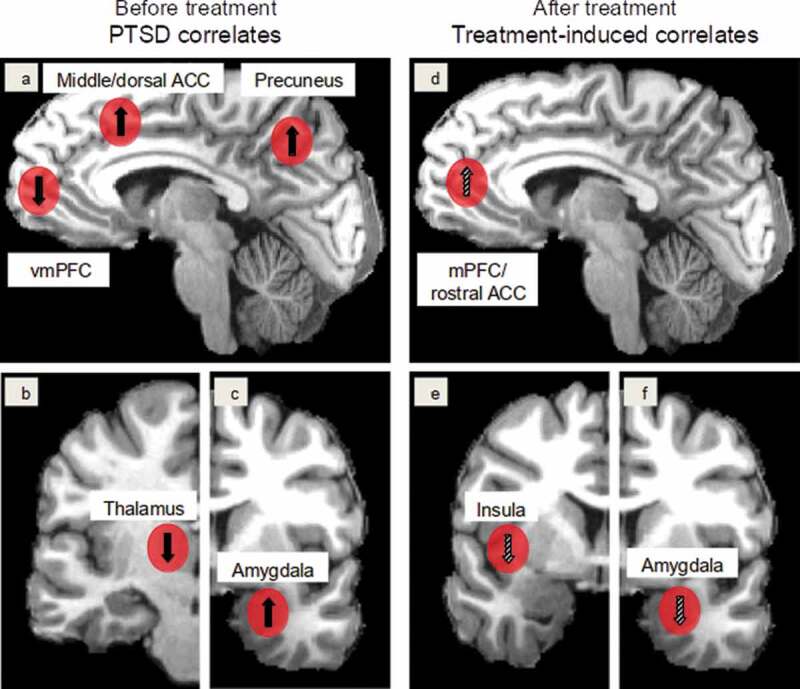
Figure 2.

PTSD correlates found in meta-analyses (see Introduction) (left column, 2a,b,c) and treatment-induced activation changes discussed in this review (right column, 2d,e,f). Red spheres mark the neural regions. In the left column, upward and downward arrows indicate hyperactivation and hypoactivation of the regions before treatment, respectively, and in the right column upward and downward arrows indicate increases and decreases in activation changes following treatment, respectively. Limited and inconsistent findings are marked with hatched arrows. Abbreviations: ACC: anterior cingulate cortex, (v)mPFC: (ventro)medial prefrontal cortex
