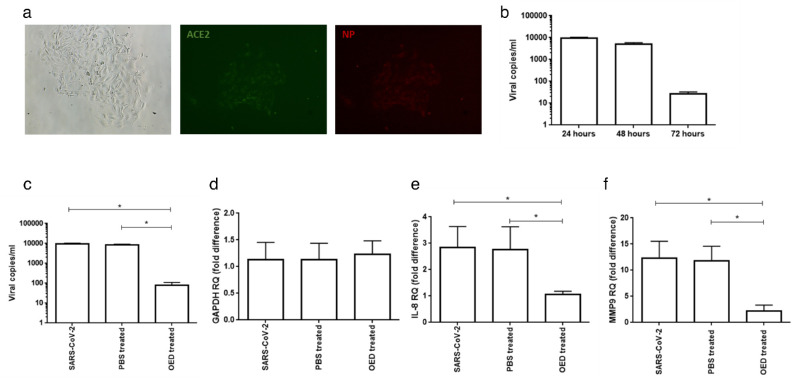
Figure 7.
(a) Immunofluorescence analysis of the expression of angiotensin-converting enzyme 2 (ACE2) (middle panel) and the SARS-CoV-2 nucleoprotein (right panel) on the surfaces of hCE-2 cells infected with SARS-CoV-2 at an MOI of 1.0 for 24 hours. A Nikon Eclipse TE2000S system equipped with 621 was used as the digital camera; original magnification ×10 . (b) hCE-2 cells were infected with SARS‐CoV‐2 at an MOI of 1.0 for one hour at 37 °C. Thereafter, the cells were washed and cultured for 48 hours. Viral yield was quantified using the cell supernatant with quantitative reverse‐transcription PCR (qRT‐PCR). At least three independent replicates were assessed. Data are representative of three independent experiments. hCE-2 cells were infected with SARS‐CoV‐2 at an MOI of 1.0 in the absence or presence of OED. (c) Viral yield was quantified in the cell supernatant using qRT‐PCR. At least three independent replicates were analyzed. Data are representative of three independent experiments. (*p < 0.001). qRT–PCR results for (d) GAPDH, (e) IL-8, and (f) MMP9 in hCE-2 after 24 hours of infection with SARS‐CoV‐2 at an MOI of 1.0 without (PBS-treated) or with OED (OED-treated). The results are expressed as the mean of triplicate experiments after 24 hours of treatment (*P < 0.001).

