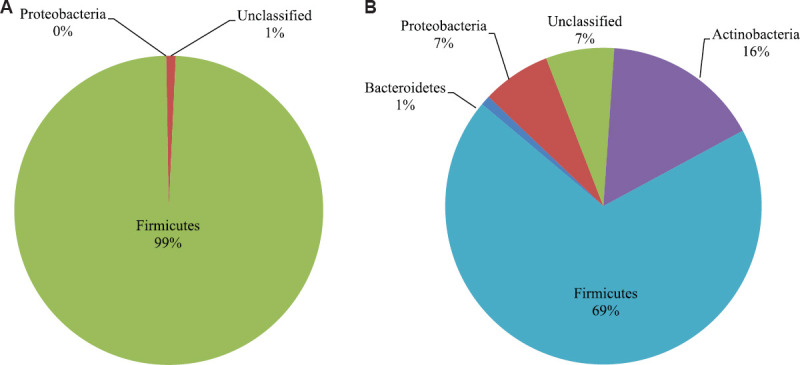
Fig. 1.

Relative abundance of the bacterial groups representing the vaginal microbiota of normal and bacterial vaginosis (BV) positive women. Pie charts showing the phylum-level distribution of bacterial relative abundance (%) in the vagina of the (A) normal women and (B) BV positive women.
