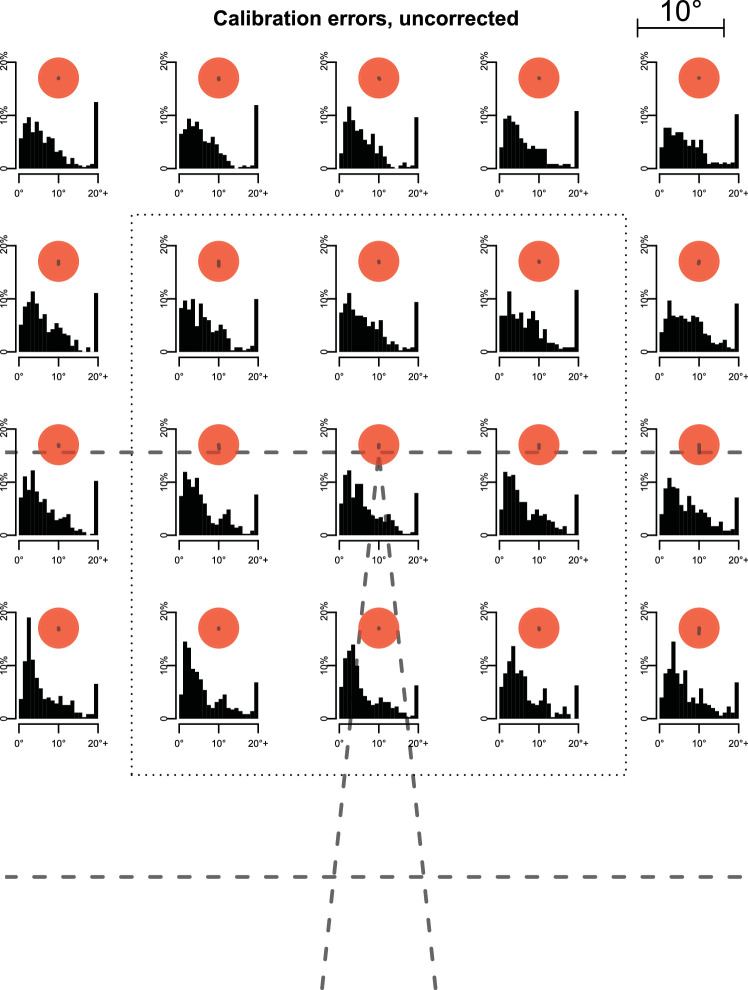
Figure 10.
Distributions of calibration errors. As no motion-capturing data were recorded during calibration phase, we compared gaze positions eye-in-head with the position of red calibration dots retrieved from the head-cam videos. Periods of fixation were selected from the video by independent annotators for each fixation point separately. Within the thus identified period, we selected the 100-ms interval, in which gaze was closest to the fixation point, and took the maximal Euclidian distance within this interval as error measure for the respective block and participant. Shown are data across all blocks in both experiments combined. Bins for 20+ may include dots where the automatic detection did not work as intended, so that error medians are likely slightly overestimated. Dashed lines indicate the outlines of the treadmill and virtual road (visible during calibration), bottom of the screen, and virtual horizon. Size of the red dots is scaled approximately as in the actual display, with degrees of visual angle shown in the top right corner. Errors were sometimes considerable, especially further from the center of the screen. Lines from the center of each dot outward depict mean bias (in the same scale), which was minimal. Median absolute error was 5.5, virtually the same in the center (within the dotted rectangle; over 90% of gaze was allocated here; see Figure 8) and in the periphery (outside the rectangle), at 5.6 and 5.4, respectively.

