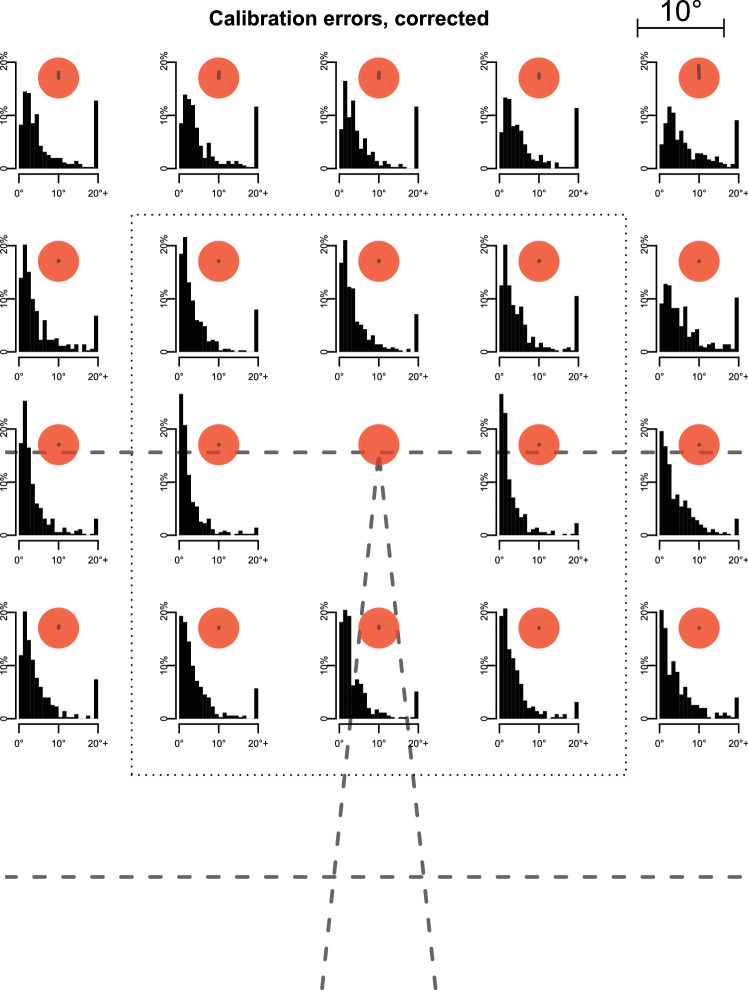
Figure 11.
Distributions of calibration errors, corrected for each participant's bias. Errors were computed as described above and then corrected for the median error in x- and y-directions of the respective participant for dot appearing at the vanishing point. We see a markedly improved accuracy compared to the uncorrected data (median error: 2.8), indicating that within-participant effects were unproblematic for the measures and analyses considered. This improvement was especially marked in the center of the display (2.2) compared to the periphery (3.4), which is unsurprising given our choice of correcting for the error at the lower central dot. Notation as in Figure 10.

