Figure 8.
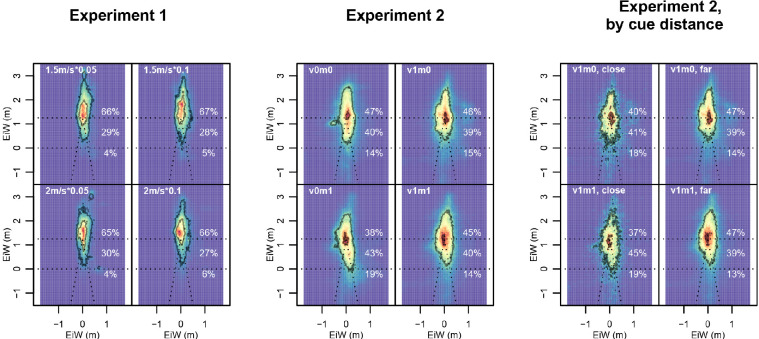
Distribution of gaze orientation depending on experimental condition. Eye-in-world is plotted in absolute coordinates (units of meters). Colors show relative density over entire blocks, from blue (lowest) to dark red (highest). Contours delineate areas containing 10% and 90% of data. Dotted lines indicate the outlines of the treadmill belt, bottom of the screen, and virtual horizon. Numbers on the right in white indicate what proportion of the time gaze was directed (a) above the virtual horizon, (b) on the screen below the virtual horizon, and (c) on the treadmill belt or its extension in front of the screen. Left: Experiment 1; middle: Experiment 2; right: Blocks of Experiment 2 in which visual cues were given, split up by whether this visual cue was on the treadmill belt (left column) or further away, that is, above the belt (right column). We see the highest density centrally close to the virtual horizon and most variation along the line of progression. Also visible are small local peaks close to the bottom of the screen, roughly 0.5 m (Experiment 1) or 1 m (Experiment 2) off center; here were motion-capture cameras. Crucially, we see that participants directed their gaze toward the treadmill much more when this was where the visual cue was (second-to-right column), compared to both when the cue was farther away (rightmost column). We also see that even in conditions where no visual cue was present, participants’ gaze patterns in Experiment 2 were much more focused around the vanishing point (and consequently lower) than in Experiment 1.

