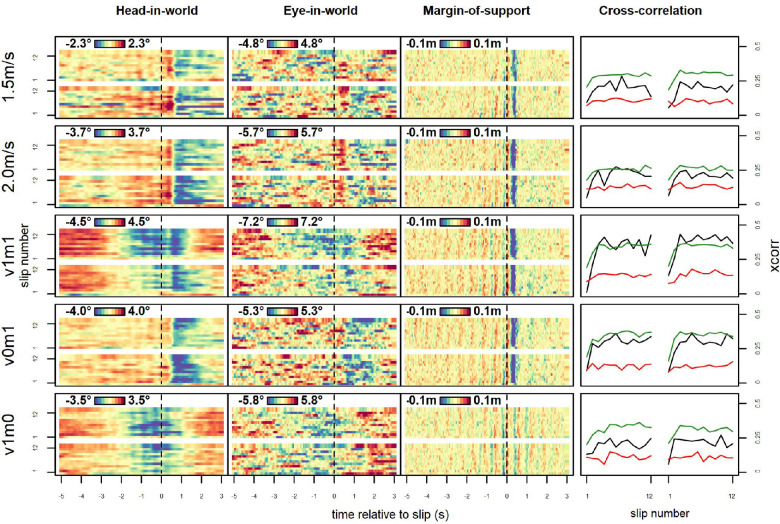
Figure 9.
Gaze and gait parameters relative to slips, by slip number. The x-axis shows time relative to the slip; y-axis shows slip number. Colors indicate vertical gaze parameters and margin of support relative to the mean of each window, in m, with shading relative to the range of each parameter. Plotted are the means for the first 12 events (minimum number of perturbations presented in a block) of each of the two blocks that each condition was presented to each participant, with each row showing one condition. As each condition was presented to each participant in two separate blocks, the bottom half of each panel shows the first block of the corresponding condition and variable while the second half (above the white line) shows the second block. All colors adjusted for the range within each variable. In addition to clear patterns of decreases (blue) and increases (red) that may in some instances decrease over time, oscillations are also visible (as striation) in . Note that for Experiment 1, data are collapsed across blocks of different perturbation probabilities. Critically, patterns visible across virtually all slips were absent in first slips for head-in-world. Rightmost column: Median cross-correlation (maximum lag: 0.2 s) for each slip with all other slips of the same participant within the same condition, indicating how typical each slip's trajectory was. Plotted are head-in-world (black), eye-in-world (red), and (green).

