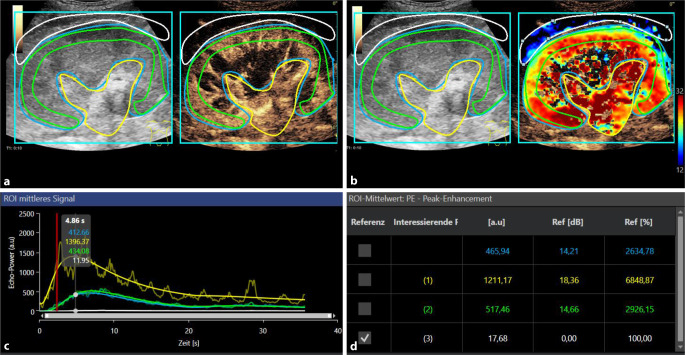
Fig. 3.
Contrast-enhanced ultrasound perfusion imaging of a kidney. a Early arterial hypervascularization at the center with wash-out beginning in the venous phase. b Evaluation of the peak enhancement with lower levels at the kidney cortex in a case of reduced peripheral microvascularization (green/blue). c Dynamic curve analysis up to 60 s. d Numeric values of the TIC analysis (c), VueBox® Screenshot with permission of Bracco Imaging, Italy

