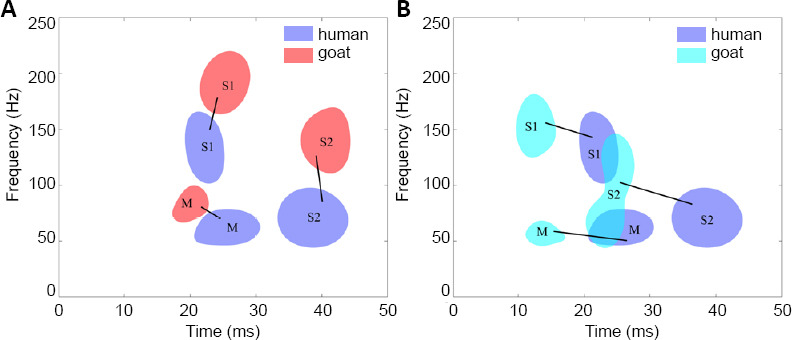
Figure 3.

Distribution patterns of SEP TFCs from normal humans, rat and goat groups.
(A) Distribution difference between the human and goat groups. (B) Distribution difference between the human and rat groups. The distribution regions of the main components were marked as “M”, and the sub-TFCs were marked as “S1” and “S2”. The distribution patterns of the components in the rat and goat groups were similar to that in the human group, and the corresponding distribution regions of TFCs that appeared in both the human group and each animal group were matched with black lines. SEP: Somatosensory evoked potential; TFC: time–frequency component.
