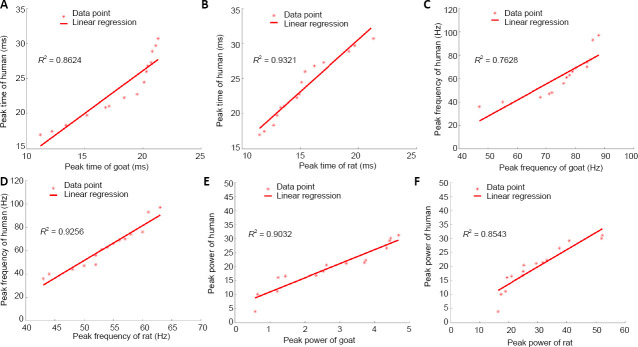
Figure 5.
Linear regression curve of main SEP TFCs between human and animals.
(A–F) Linear regressions of main SEP TFCs between peak time: human and goat groups (A), human and rat groups (B); between peak frequency: human and goat groups (C), human and rat groups (D); and between peak power: human and goat groups (E), human and rat groups (F). Data points were marked as “*”, and red lines represent the regression lines. R2 is the determination coefficient, which represents the fitting performance of the model. SEP: Somatosensory evoked potential; TFC: time–frequency component.

