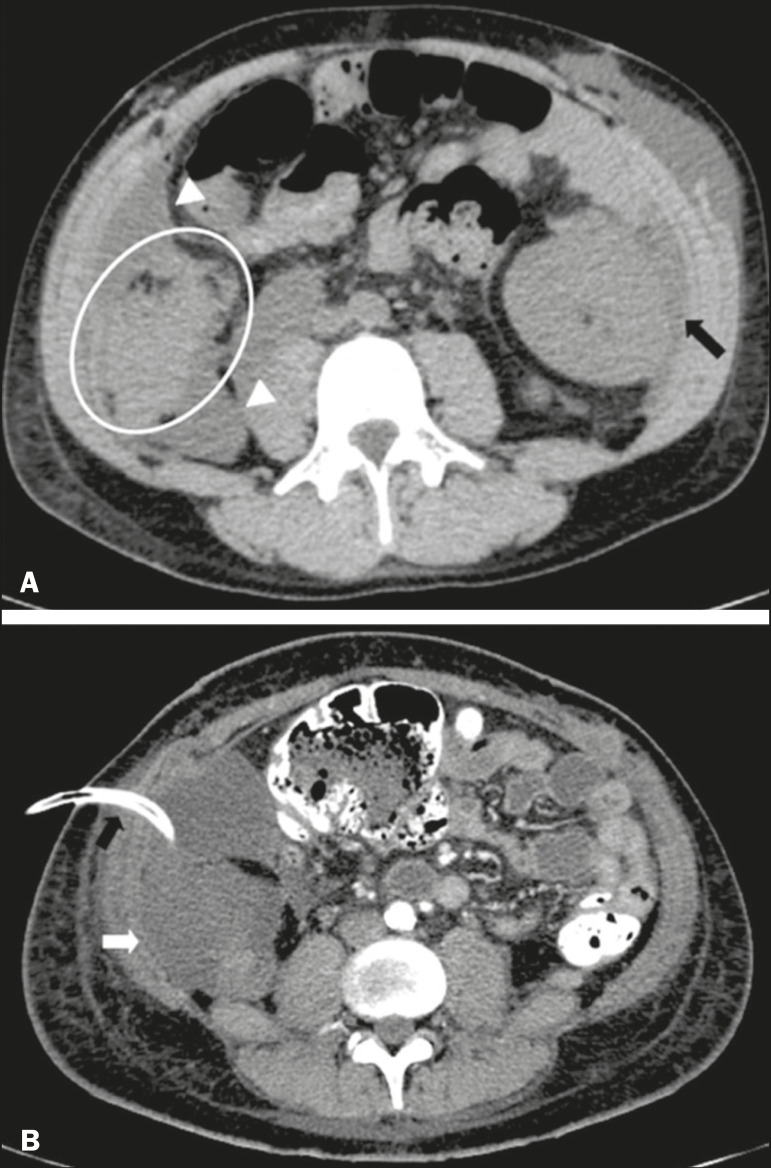
Figure 11.
A: Unenhanced axial CT scan of the abdomen, showing fluid collections (arrowheads) adjacent to the pancreatic graft (ellipse). Note also the minimal amount of liquid adjacent to the renal graft on the left (black arrow). B: Fluid collection (white arrow) in the right iliac fossa of patient who underwent SPKT with percutaneous drainage (black arrow) seen on an axial CT scan of the abdomen with oral contrast.

