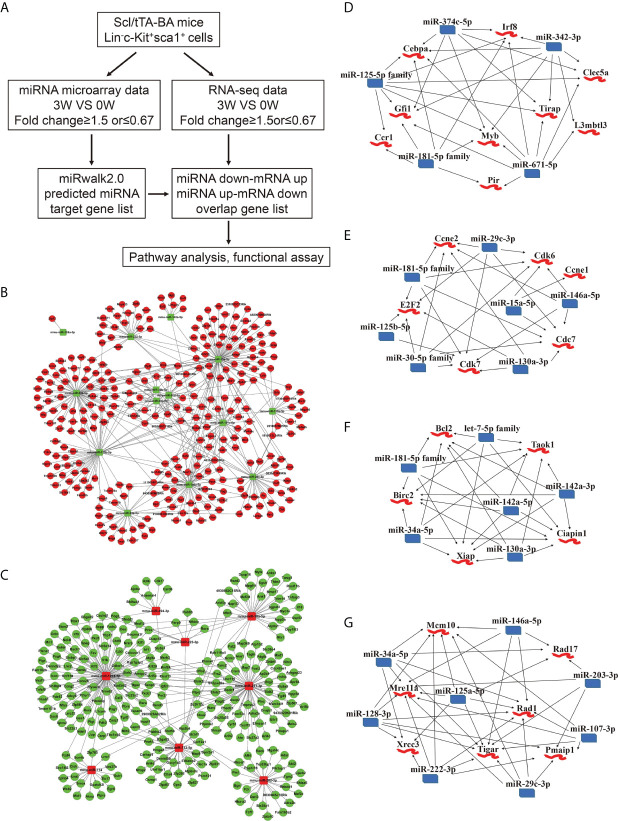
Figure 3.
Integrated analysis of miRNA-mRNA regulatory networks in murine CML LSKs. (A) Integrated analysis flowchart of the screened miRNAs and predicted target genes. (B, C) The correlation networks showing 431 interactions built between 14 downregulated miRNAs and 299 possible target genes (B), and 318 interactions between 8 upregulated miRNAs and 271 possible target genes (C). (D–G) Visualization of the regulatory networks enriched for four pathways including myeloid differentiation (D), cell cycle (E), anti-apoptotic pathway (F), and DNA damage (G).

