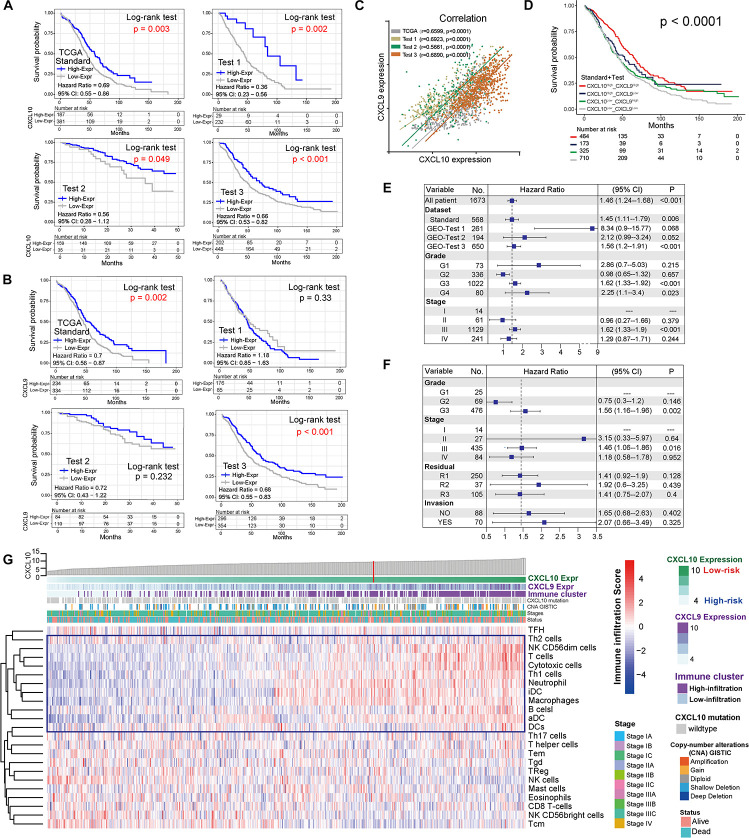
FIGURE 1.
Landscape of the CXCL10 and CXCL9 expression and TME cells-infiltration in ovarian cancer. (A) Kaplan-Meier survival analysis of CXCL10 expression in four independent cohorts of ovarian cancer. Patients were stratified into low- (blue; CXCL10 high expression) and high- risk (gray; CXCL10 low expression) classifications with a cutoff value of OS by survminer. Log-rank P < 0.05 showed a significant survival difference. (B) Kaplan-Meier survival analysis of CXCL9 expression in four independent cohorts of ovarian cancer. (C) Correlation analysis between CXCL10 and CXCL9 expression in four independent cohort. The r values were verified by the Pearson test (P < 0.0001). (D) Survival analyses for subgroup patients stratified by both CXCL10 and CXCL9 expression with Kaplan-Meier curves (P < 0.0001, Log-rank test). (E) Forest plot representation of the clinical prognostic value between high/low risk classification in independent cohorts and clinical parameters. Hazard ratios (HR) > 1.0 indicated that CXCL10 expression is a favorable prognostic biomarker. (F) Subgroup analyses estimated prognostic value of tumor pathology in standard cohort. (G) Heat map showed the scoring of TME immune cell infiltration in the standard cohort according to CXCL10 and CXCL9 expression subgroups. The thick line represented the unsupervised clustering of positive correlation. The risk classifications, immune cluster subgroups, Copy-number alteration (CNA), survival status and stages were used as patient annotations.

